

- Home
- >
- FX Daily Forecasts
- >
- NZD/CAD: Possible long after break of the horizontal resistance

NZD/CAD: Possible long after break of the horizontal resistance
Rating:

NZD/CAD:
Date: 1 November, 2016
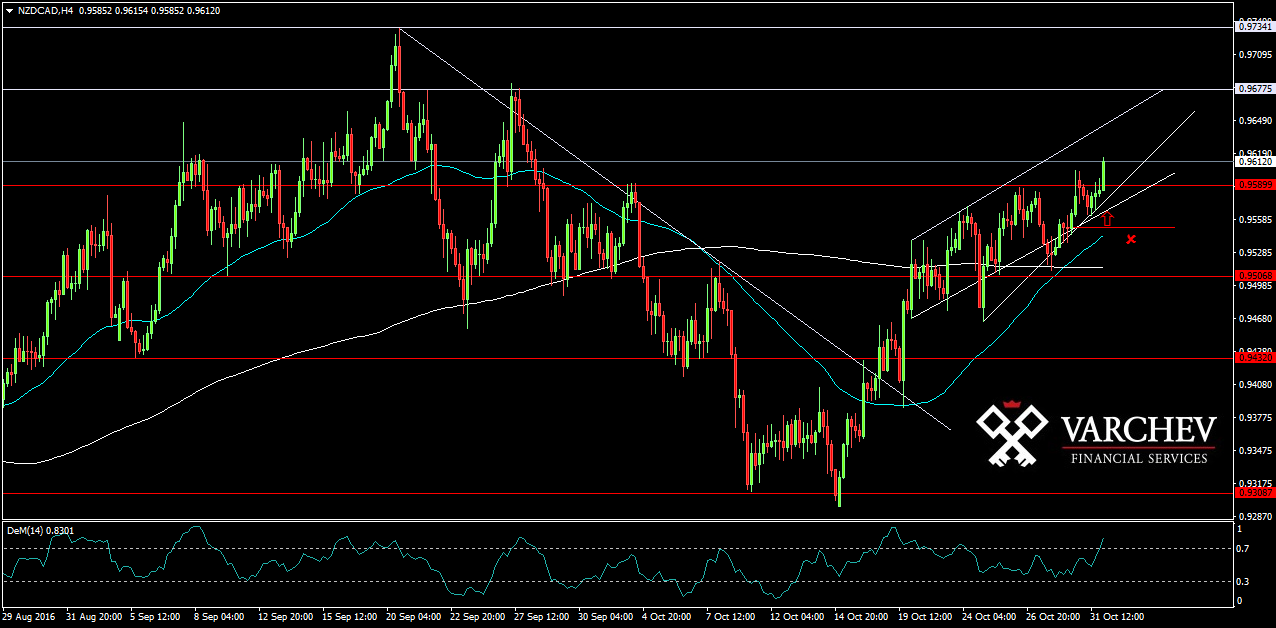
H4 Graph: Short term Long
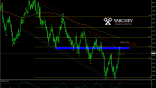
The price made a break of the horizontal resistance at 0,95900. The tendensy for long remains as the price makes higher lows. 50 МА moves above the 200 МА on H4. Close to the diagonal support, good level for long after break of horizontal resistance. Awaiting pullback on possible retest of the 0.95900 level.

Alternative Scenario: If the price moves below the horizontal support now and diagonal support, this will cancel the bullish view.
Technical Indicator:
DEM (14): - In the overbought zone
Price for Entry long around:0,9600
SL: 0.95500
Jr. Trader - S. Fuchedzhiev
 Varchev Traders
 Read more:

RECCOMEND
WAS THIS POST USEFUL FOR YOU?
If you think, we can improve that section,
please comment. Your oppinion is imortant for us.
If you think, we can improve that section,
please comment. Your oppinion is imortant for us.

