

- Home
- >
- FX Daily Forecasts
- >
- NZD/JPY: New long position, close to diagonal support

NZD/JPY: New long position, close to diagonal support
Rating:

NZD/JPY:
Date: 14 November, 2016
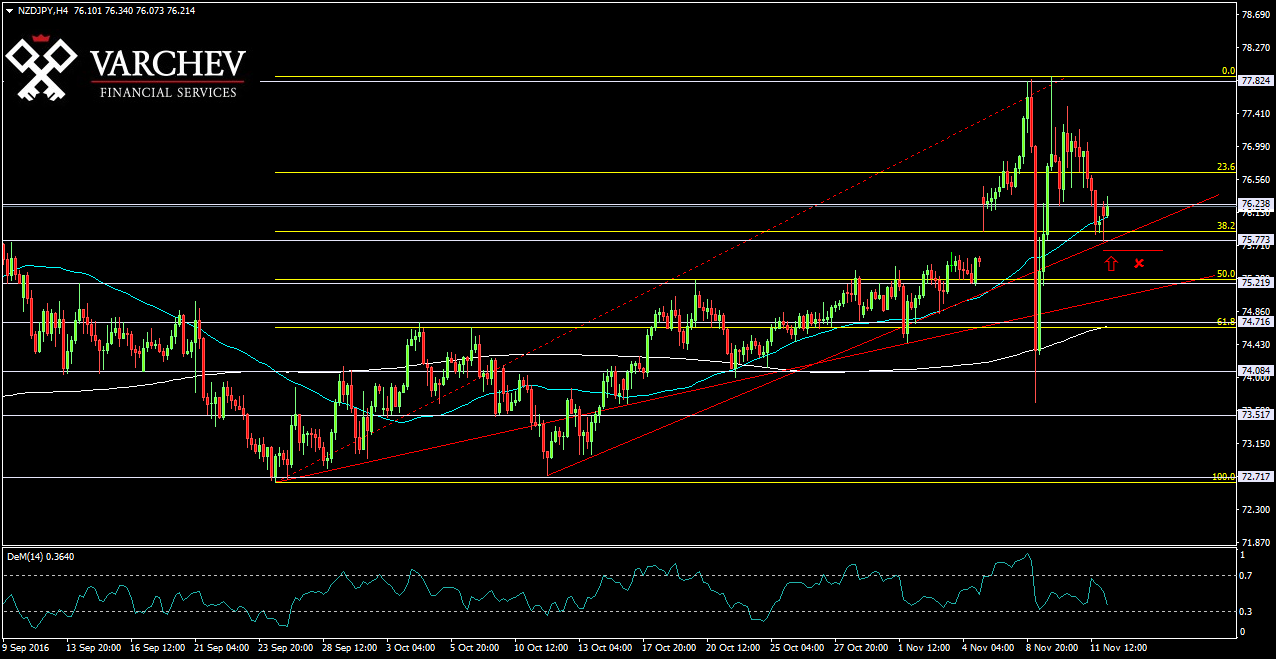
H4 Graph: Medium term long trend
The price made a correction again, after reaching the high of 77,83. The fall stopped in a zone where we can see horizontal support at 75,770. Diagonal support from the bottom of the previous move up and also Fib level of 38,2%. The price also remains above both 50 and 200 ЕМА.
Price Action: Doji bar at level of horizontal and diagonal support - Possible signal for long.

Alternative scenario: If the price continue down and crosses previous low at 75,77 and below the diagonal support, this will cancel this bullish scenario.
Technical Indicator:
DEM (14) - Near the oversold zone
Price for Entry long around: 76.00
SL: 75.50
Jr. Trader - S. Fuchedzhiev
 Varchev Traders
 Read more:


RECCOMEND
WAS THIS POST USEFUL FOR YOU?
If you think, we can improve that section,
please comment. Your oppinion is imortant for us.
If you think, we can improve that section,
please comment. Your oppinion is imortant for us.

