

- Home
- >
- FX Daily Forecasts
- >
- NZD/JPY opportunity to profit from short positions

NZD/JPY opportunity to profit from short positions
Rating:

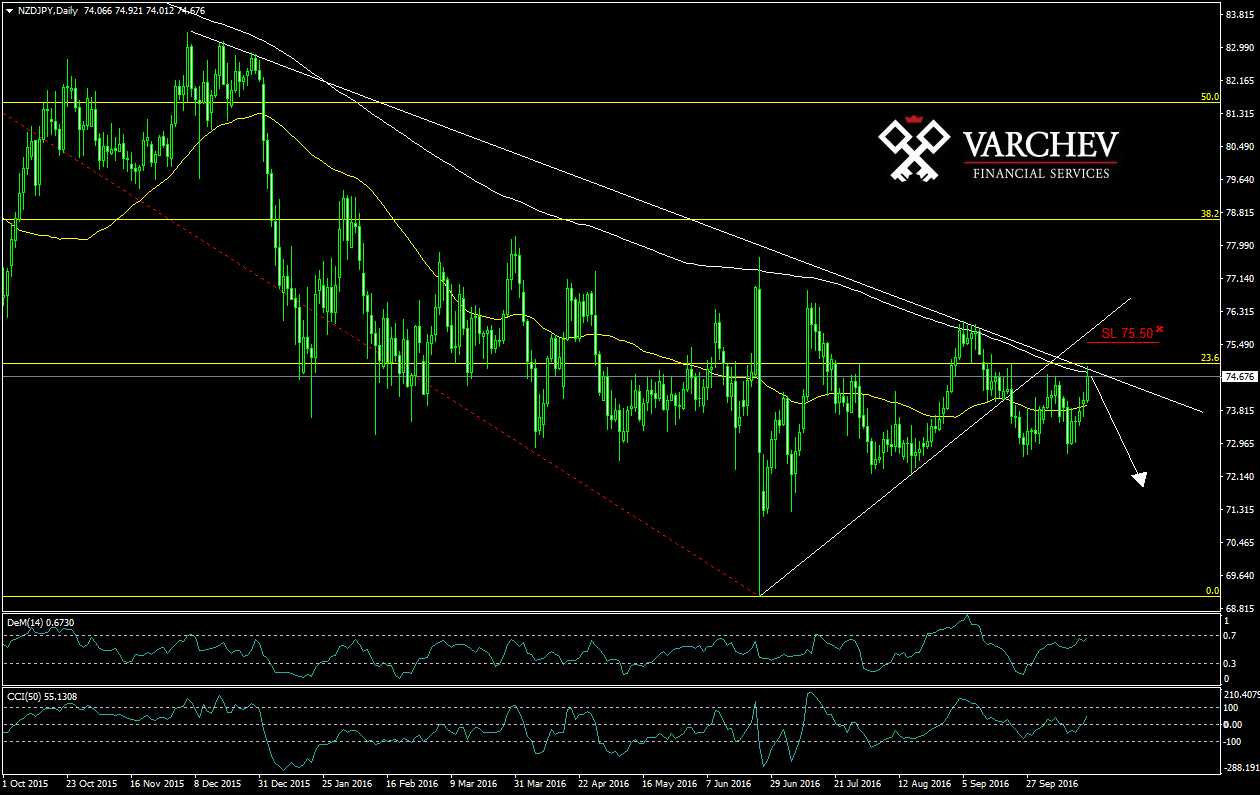
NZD/JPY 18.10.2016 D1 chart.
Downtrend and correctio to 23,6 Fibonacci.
Price below resistances - diagonal and horizontal.
Technical indicators:
False break of 200SMA - negative signal
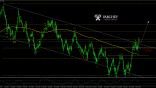
H4 chart:

Price action: 2 pin bars spinning tops for probabale reversal and downward movement
CCI(50) and DeM(14) - reverse in overbought zone - negative signal
SL: 75.50
Alternative scenario: Break above 200SMA on D1 chart will negate the negative formation.
Jr. Trader Nikolay Georgiev
 Varchev Traders
 Read more:


RECCOMEND
WAS THIS POST USEFUL FOR YOU?
If you think, we can improve that section,
please comment. Your oppinion is imortant for us.
If you think, we can improve that section,
please comment. Your oppinion is imortant for us.

