

- Home
- >
- FX Daily Forecasts
- >
- NZD/USD: Long is more likely from here by the Trend

NZD/USD: Long is more likely from here by the Trend
Rating:

NZD/USD:
Date: April 25, 2016
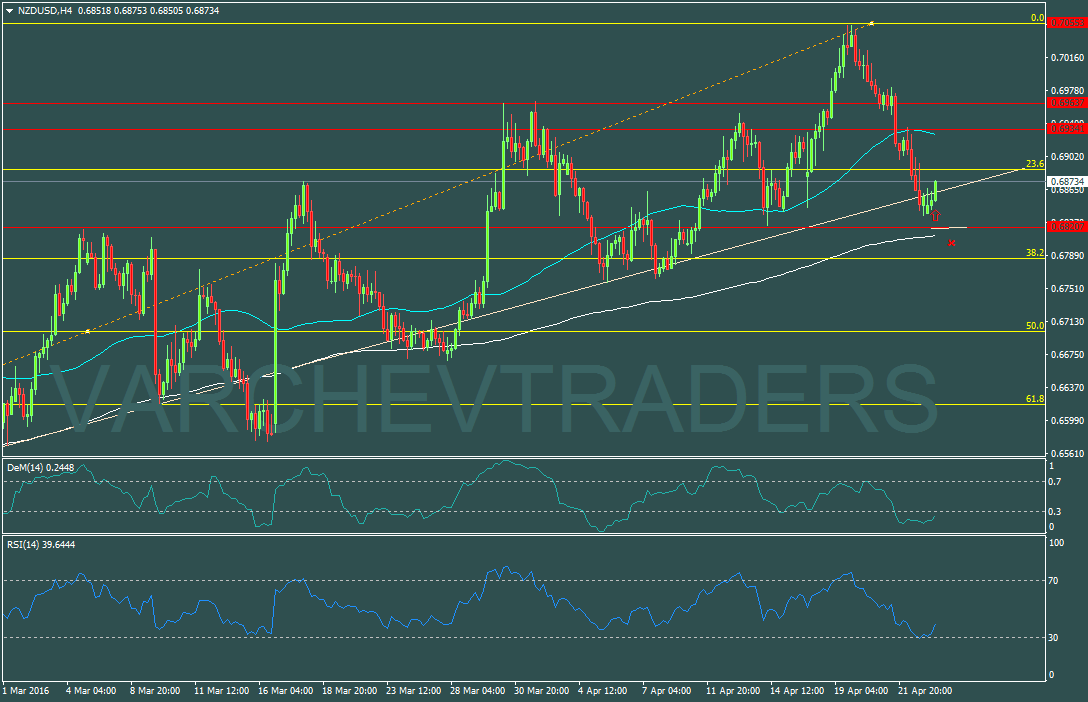
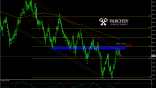
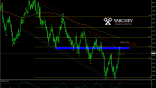
4H Graph: Long Trend
The price made a correction down to the Trend line, close to the FIB 38,2%, but the price holds above the horizontal support, diagonal support and above the FIB 38.2. The price continue to make higher highs and higher lows.

Alternate scenario: If the price breaks down below 0,68100 and below the diagonal and horizontal supports will cancel the bearish view.
Technical Indicators:
DEM (14) H4 - is in the overbought zone and turning for long
RSI(14) H4 - has reached level 30 and turns up for long
Price for Entry long around: 0,68600
SL: 0.68100 - Below the previous low
Jr. Trader - S. Fuchedzhiev
 Varchev Traders
 Read more:
RECCOMEND
WAS THIS POST USEFUL FOR YOU?
If you think, we can improve that section,
please comment. Your oppinion is imortant for us.
If you think, we can improve that section,
please comment. Your oppinion is imortant for us.

