

- Home
- >
- Opportunities for profit today
- >
- NZD/USD: price action for possible decline

NZD/USD: price action for possible decline
Rating:

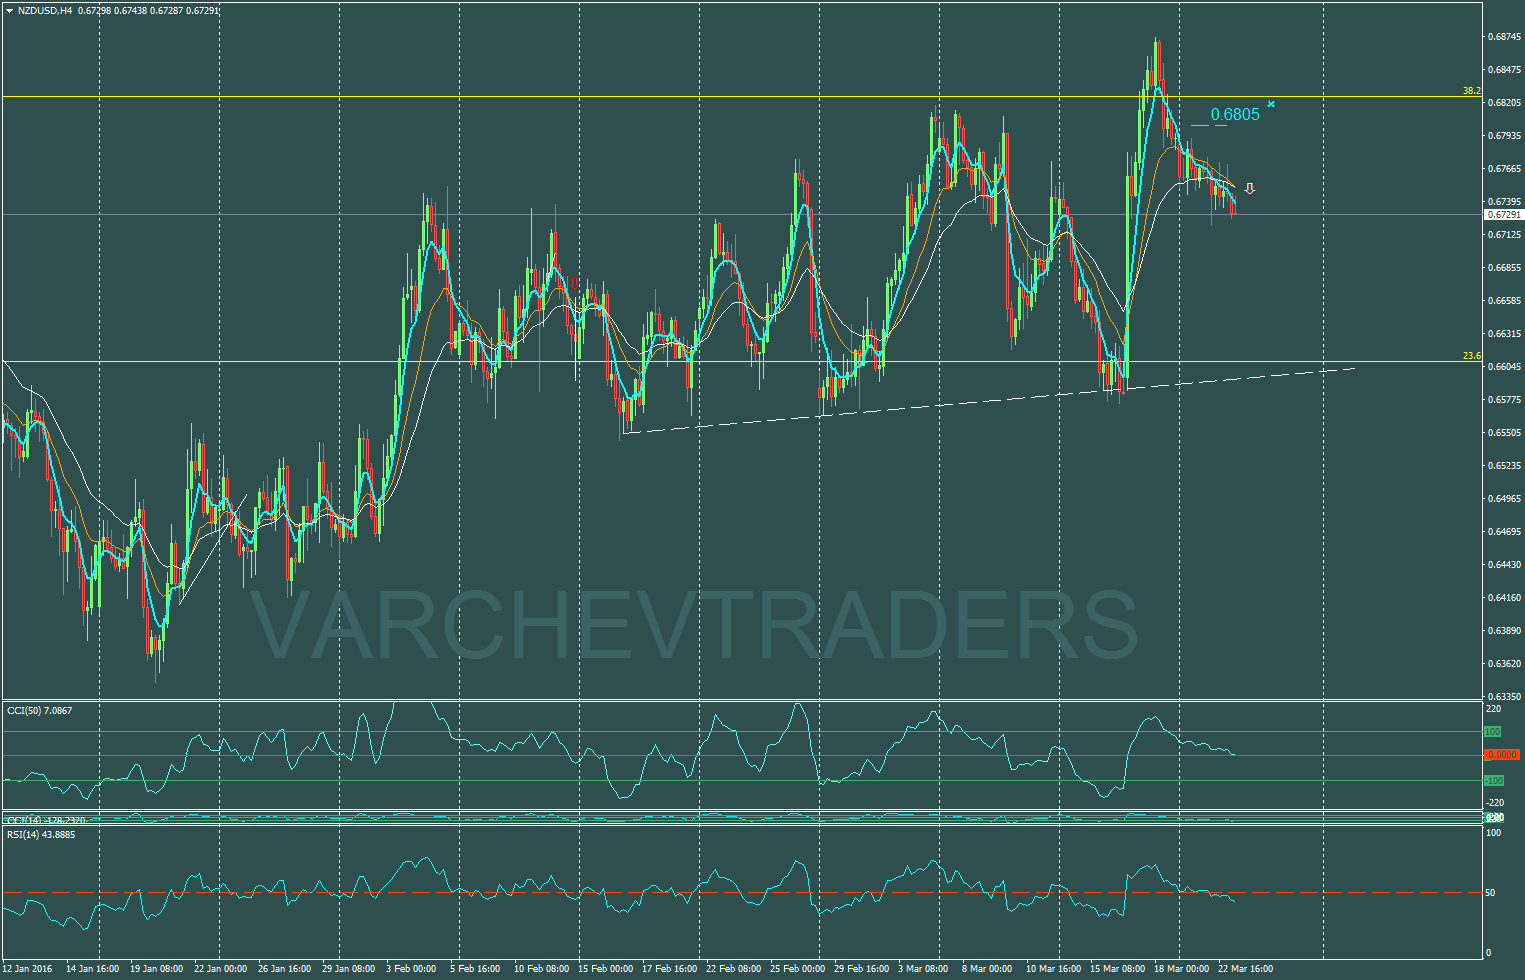
NZD/USD : 4 H chart – wide consolidation in daily short trend
The price is below dynamic resistances – 5 EMA , 13 EMA , 25 EMA.
Two pin bars at levels of resistance and formation “tweezers” , which increase the probability of new descending impulse.
Engulfing Pattern – engulfing bar
Fibo – correction to 38.2 % of the descending trend
Alternative scenario – If the price go above 0.6805 will destroy negative formation and will give us signal for possible
increase .
Technical indicators :
RSI above 50
5 EMA is going under 13 EMA – Moving averages set in bearish formation
Downtrend , price below resistance , price action signal
SL: 0.6805
Stefan D.Angelov- Head of Stocks Trading
 Varchev Traders
RECCOMEND
WAS THIS POST USEFUL FOR YOU?
If you think, we can improve that section,
please comment. Your oppinion is imortant for us.
If you think, we can improve that section,
please comment. Your oppinion is imortant for us.

