

- Home
- >
- FX Daily Forecasts
- >
- NZD/USD: third lower top and a probable downward impulse

NZD/USD: third lower top and a probable downward impulse
Rating:

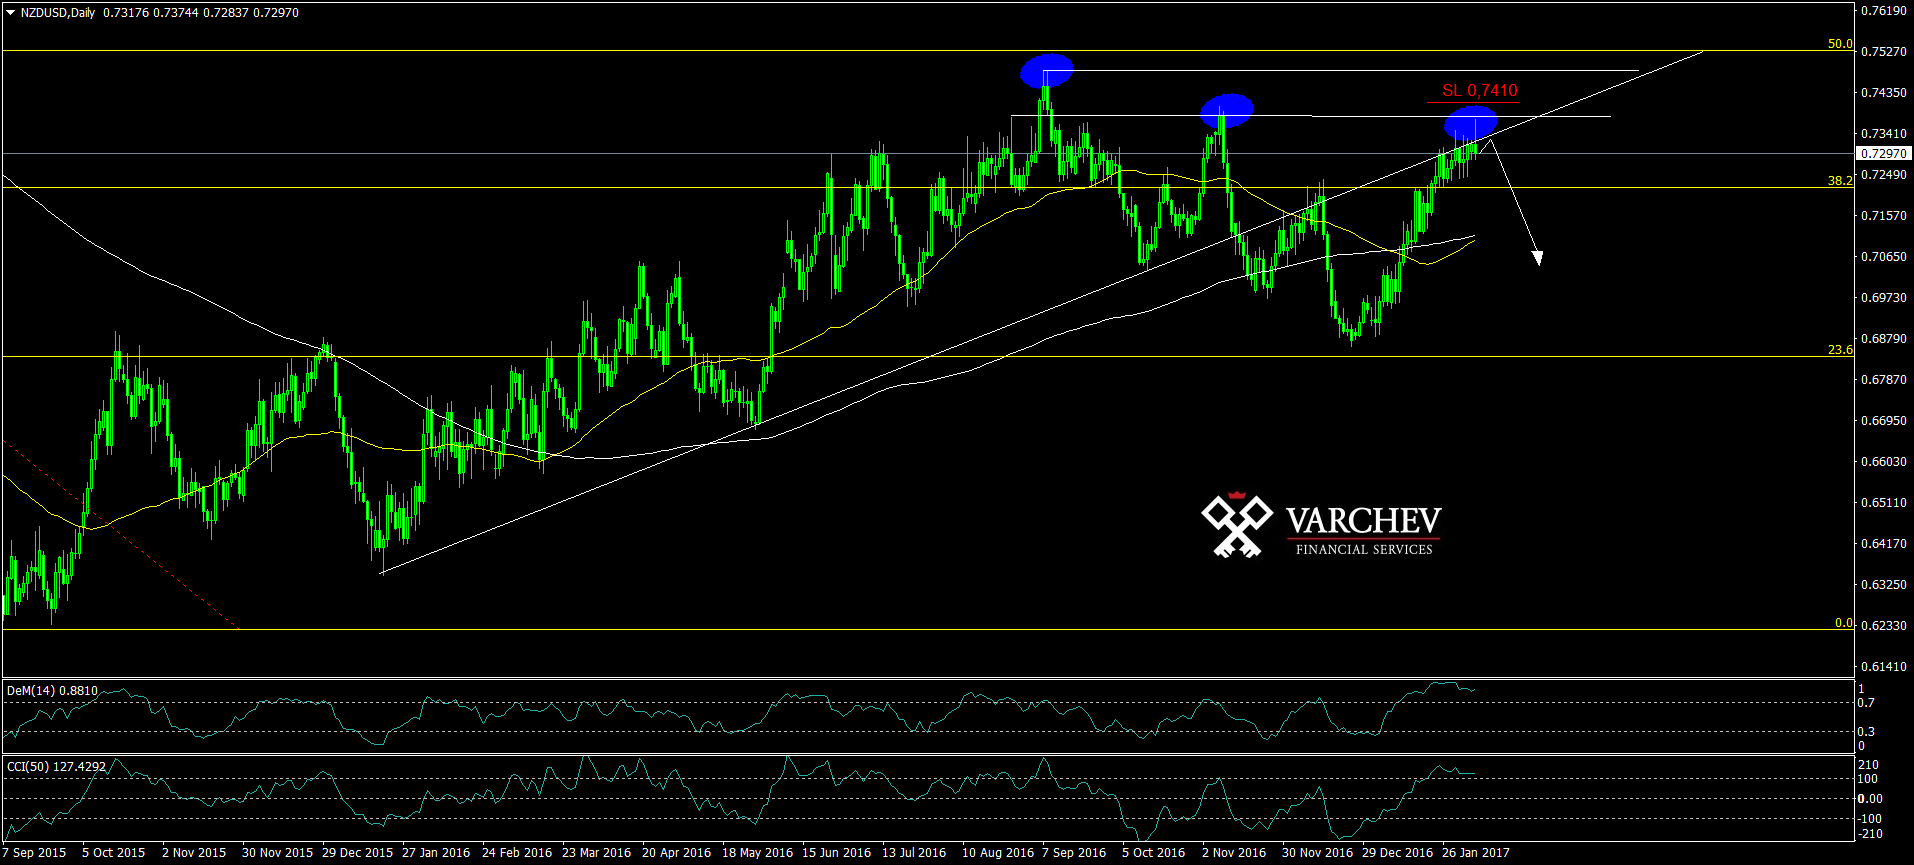
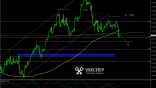
NZD/USD: 07.02.2017 D1 chart.
Long term downtrend, correction to 50% Fibonacci.
Third lower top below zone of horizontal resistance - strong signal for a probable downward movement.
Price below diagonal resistance - negative signal.
Price action: bearish engulfing at the end of a clear uptrend on H4 chart and probable pin bar on D1 - probable downward impulse.
Indicators:
DeM(14) in strong overbought zone above 0,7 - reversal will confirm a sell
CCI(50) above 100 as crossing below can be used as confirming sell signal
SL 0,7410
Alternative scenario: Break above the upper shadow of the current bar will lead to test of the 50% Fibo level.
Trader Nikolay Georgiev
 Varchev Traders
 Read more:

RECCOMEND
WAS THIS POST USEFUL FOR YOU?
If you think, we can improve that section,
please comment. Your oppinion is imortant for us.
If you think, we can improve that section,
please comment. Your oppinion is imortant for us.

