

- Home
- >
- Commodities Daily Forecasts
- >
- OIL.US 09.05.2017

OIL.US 09.05.2017
Rating:

OIL.US 09.05.2017
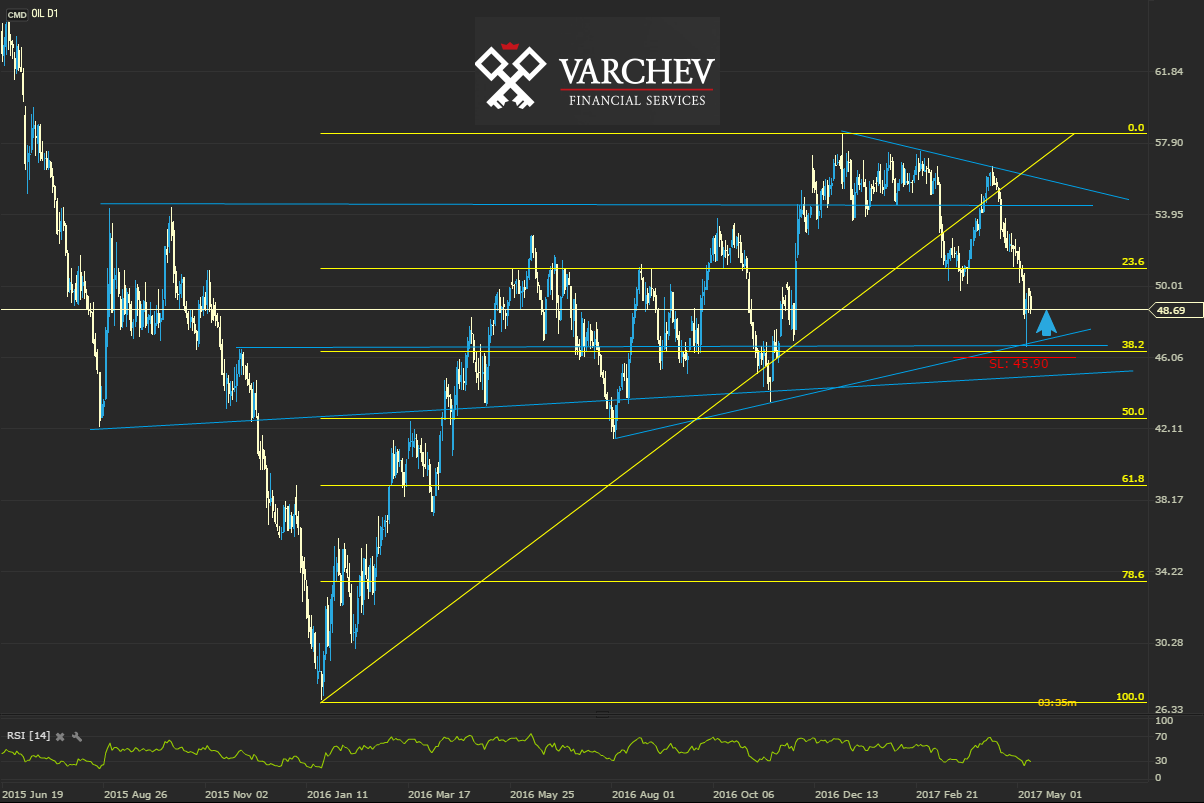
Time frame D1
Middle-term uptrend, higher tops and higher bottoms. The price reached horizontal and diagonal support and FiBo 38.2.
Price action signal: Pin bar at levels of diagonal support and FiBo 38.2
Technical indicators:
RSI(14) - Broke level 30, which is positive signal. But is trying to go back below the level which will gives us negative signal from the oscillator.
SL: 45.90
Alternative scenario: If the price goes below the diagonal support and FiBo 38.2 will make lower bottom and we may look for a short positions.
Trader Bozhidar Arabadzhiev
 Varchev Traders
RECCOMEND
WAS THIS POST USEFUL FOR YOU?
If you think, we can improve that section,
please comment. Your oppinion is imortant for us.
If you think, we can improve that section,
please comment. Your oppinion is imortant for us.

