

- Home
- >
- Stocks Daily Forecasts
- >
- Opportunity to buy Nvidia (NVDA.US) after correction

Opportunity to buy Nvidia (NVDA.US) after correction
Rating:

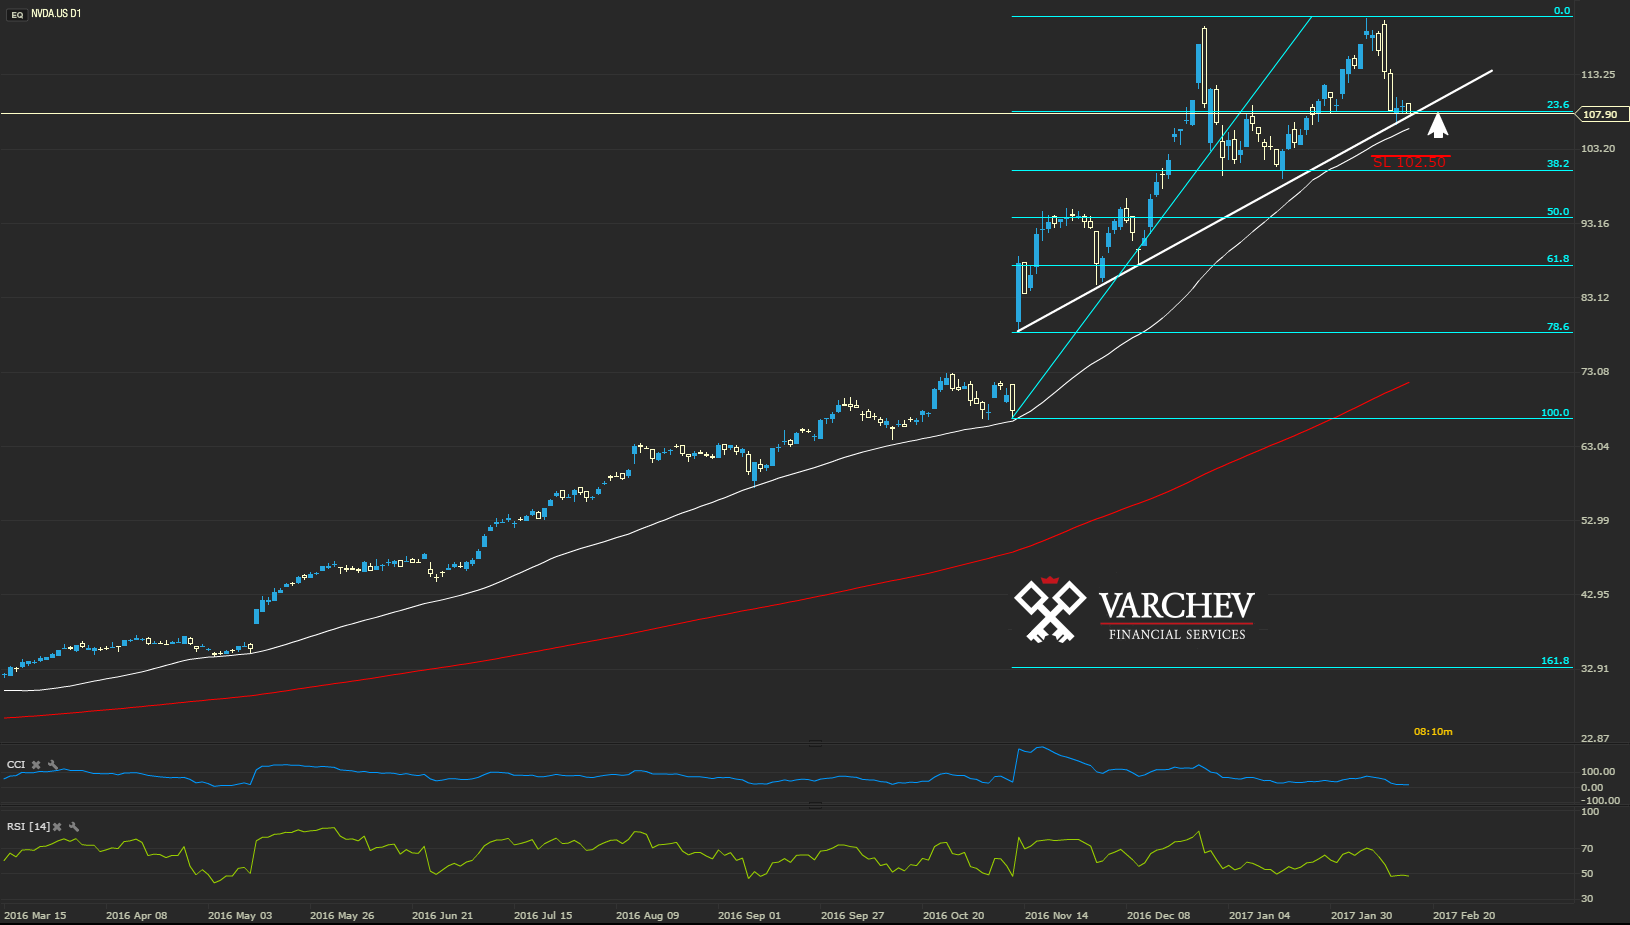
NVDA.US 16.02.2017, D1 chart
Ascending trend and correction of the last movement to 23.6 Fibo
Price above diagonal support - probable rise
Price Action: Doji bars - possible end of the correction
Indicators:
Price above 50/200 SMA - confirming the long movement
CCI(50) over 0 and RSI (14) above 50 - bulls territory - positive signal
Fundamental:
Nvidia is surpassing the leader Intel in the pace of growth and return from its systems for saving data. The company is set for expansion in the area of graphic products and processors for vehicles, which suggests new investments and purchases of the NVIDIA stocks.

SL: 102.50
Alternative scenario: A breach under the diagonal support will deny the positive outcome
Trader Nikolay Georgiev
 Varchev Traders
 Read more:
 US – Iran – Iraq tension remain the main driver of the stock market today
 How top market players on Wall St think 2020 will look like on financial markets
 Money Flow before the start of the new trading week
 Cincinnati Financial Corporation (CINF.US) -Opportunity for long positions
 Asia stocks gain as Fed signals no rate cuts in 2020
RECCOMEND
WAS THIS POST USEFUL FOR YOU?
If you think, we can improve that section,
please comment. Your oppinion is imortant for us.
If you think, we can improve that section,
please comment. Your oppinion is imortant for us.

