

- Home
- >
- Stocks Daily Forecasts
- >
- POM.FR – Opportunity for a long position

POM.FR - Opportunity for a long position
Rating:

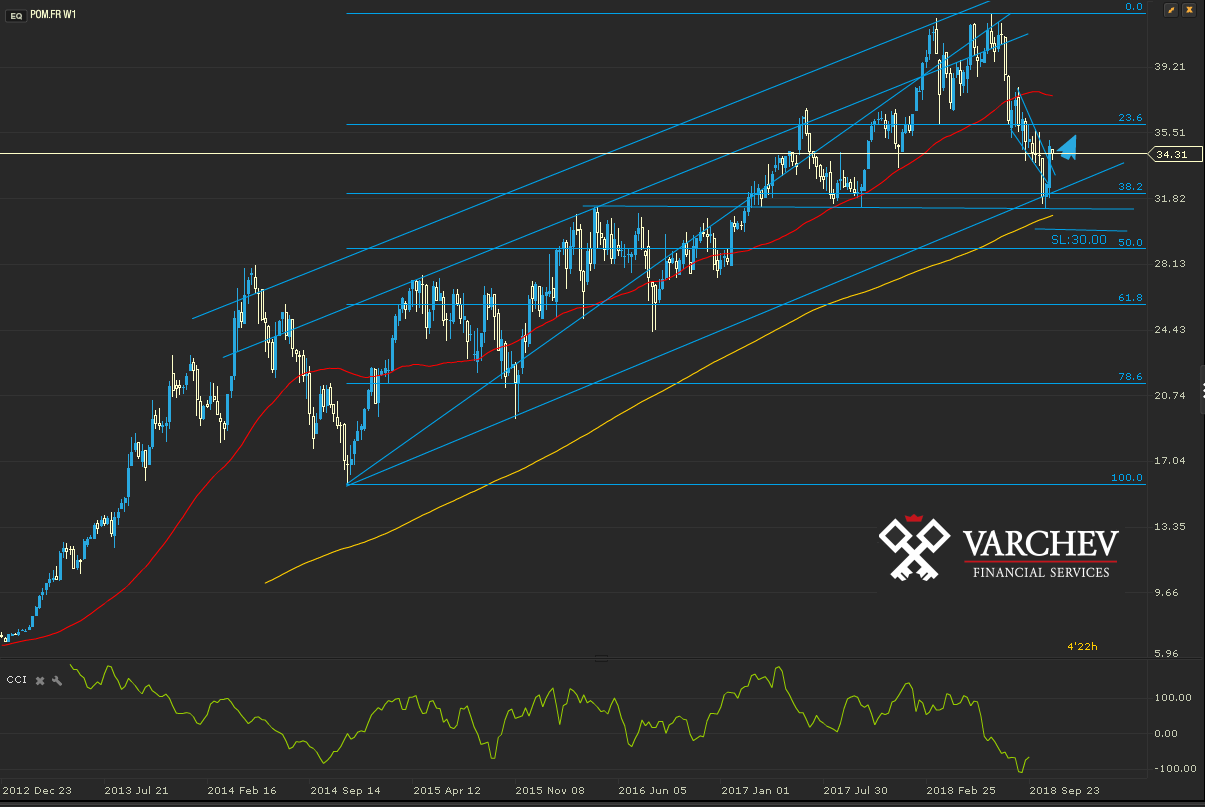
POM.FR Weekly Chart Our Expectations: Upward trend, correction to horizontal and diagonal support. Opportunity for long positions with stop 30.00
Alternative Scenario: If the price drops below the number of supports, a 50.00 Fibonacci test will follow. In this case, the bullish scenario will be cancelled.
Comment: Ascending long-term trend. Correction to horizontal and diagonal support. At these levels is also 38.2 Fibonacci, which makes them even more significant. On weekly chart late last week, an engulfing bar is formed, which is our price action signal. On Monday, the stock dropped, which played the role of correction of the engulfing bar. Breakthrough wedge in the ascending style - positive signal.
 Trader Aleksandar Kumanov
 Read more:
 US – Iran – Iraq tension remain the main driver of the stock market today
 How top market players on Wall St think 2020 will look like on financial markets
 Money Flow before the start of the new trading week
 Cincinnati Financial Corporation (CINF.US) -Opportunity for long positions
 Asia stocks gain as Fed signals no rate cuts in 2020
RECCOMEND
WAS THIS POST USEFUL FOR YOU?
If you think, we can improve that section,
please comment. Your oppinion is imortant for us.
If you think, we can improve that section,
please comment. Your oppinion is imortant for us.

