

- Home
- >
- FX Daily Forecasts
- >
- Possible long term purchases of gold

Possible long term purchases of gold
Rating:

GOLD
Time frame: H4
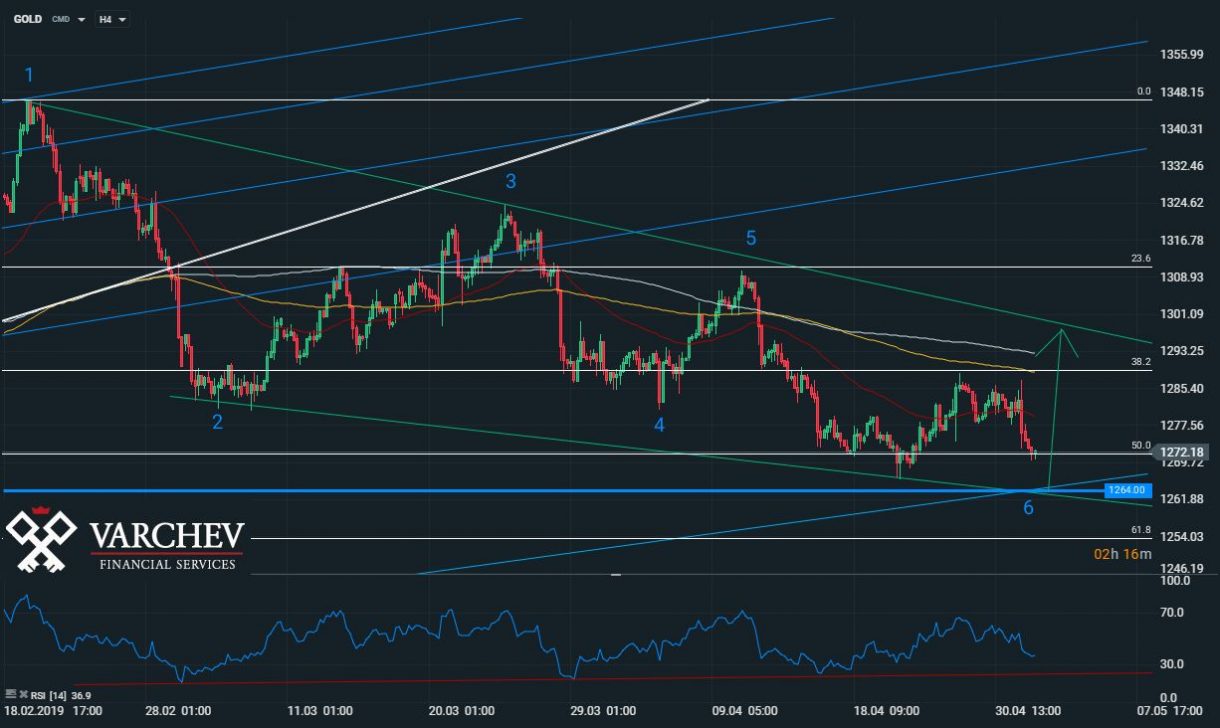
Technical Analysis: Since August 2018, gold has been in a strong upward trend, with strength to break resistance after resistance. Finally, it was able to find a strong resistance at $ 1354 from where it went down. The price began to consolidate by forming the figure "Triangle". The figure is a trend continuation, and the price is now at point 6 of which a new strong upward movement should start. Point 6 coincides perfectly with two very strong diagonal supports (the blue and green trend line). The Blue Trend Line is a long-term support that is designed from the bottom at $ 1160 to the bottom at $ 1,116. The green trend line is the support of the triangular formation. The two trend lines cross perfectly at $ 1264 where it is possible to start a new strong upward movement.
Indicators:
RSI - Displays the presence of divergence, which is an additional signal for a new upward movement.
The price is below 50 and 200 EMA, and at this stage they play a role of resistance.
Entering a deal: When the price reaches level 1264.00, we can position ourselves on the market with "buy" orders.
SL: 1250.00
Alternative scenario: If the price breaks through long-term static support, then it will continue to fall to the next strong support level at 61.8% of Fibonacci.

 Trader Milko Zashev
 Read more:

If you think, we can improve that section,
please comment. Your oppinion is imortant for us.

