

- Home
- >
- Commodities Daily Forecasts
- >
- Possible move higher, after impulse up and above support level

Possible move higher, after impulse up and above support level
Rating:

GOLD:
Date: 30 September, 2016
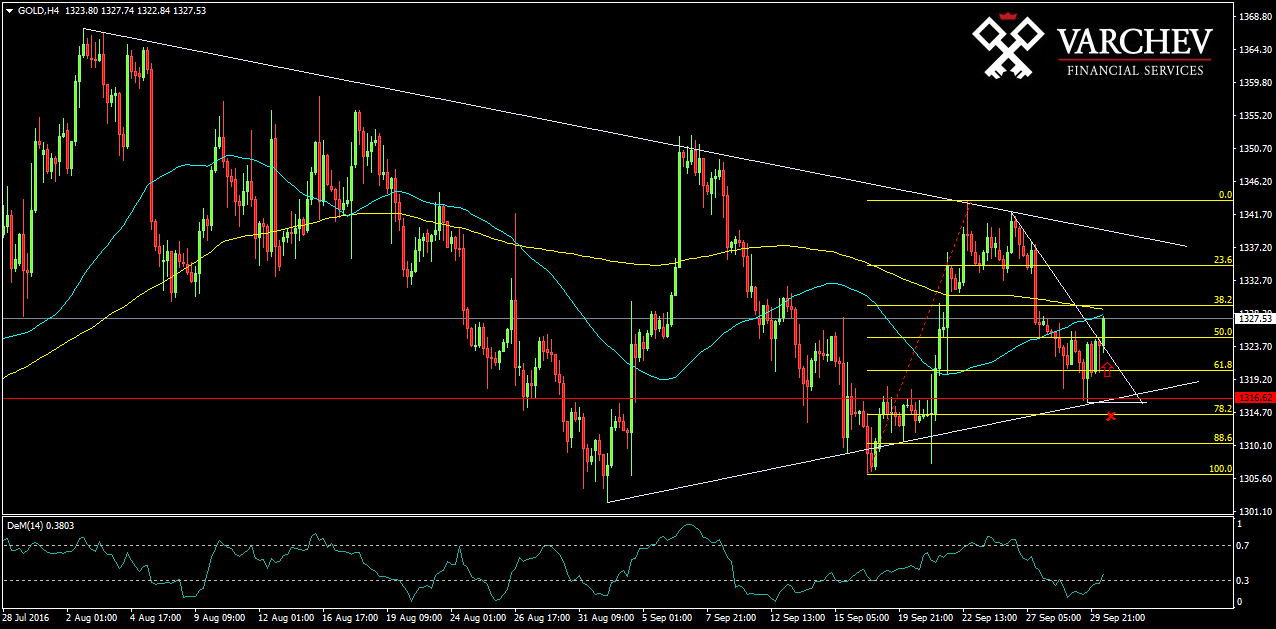
H4 Graph: Choppy and short term long
To look for longs here, we see 4th higher low and price did hold above horizontal support after the correction down to $1318,00. It is possible that we have a consolidation phase with formation " Triangle". There is an impulse for long. The horizontal support is also at the same level as the Fibo 61,8% from the previous long move.

Alternative Scenario: If the price breaks below the horizontal support and Fibo 61,8% will cancel this bullish view
DEM (14) - In oversold zone and turned up for long.
Price for Entry long around: $1325,00
SL: $1316.00
Jr. Trader - S. Fuchedzhiev
 Varchev Traders
 Read more:


RECCOMEND
WAS THIS POST USEFUL FOR YOU?
If you think, we can improve that section,
please comment. Your oppinion is imortant for us.
If you think, we can improve that section,
please comment. Your oppinion is imortant for us.

