

- Home
- >
- Opportunities for profit today
- >
- RWE.DE – Ability to add long to build a position

RWE.DE - Ability to add long to build a position
Rating:

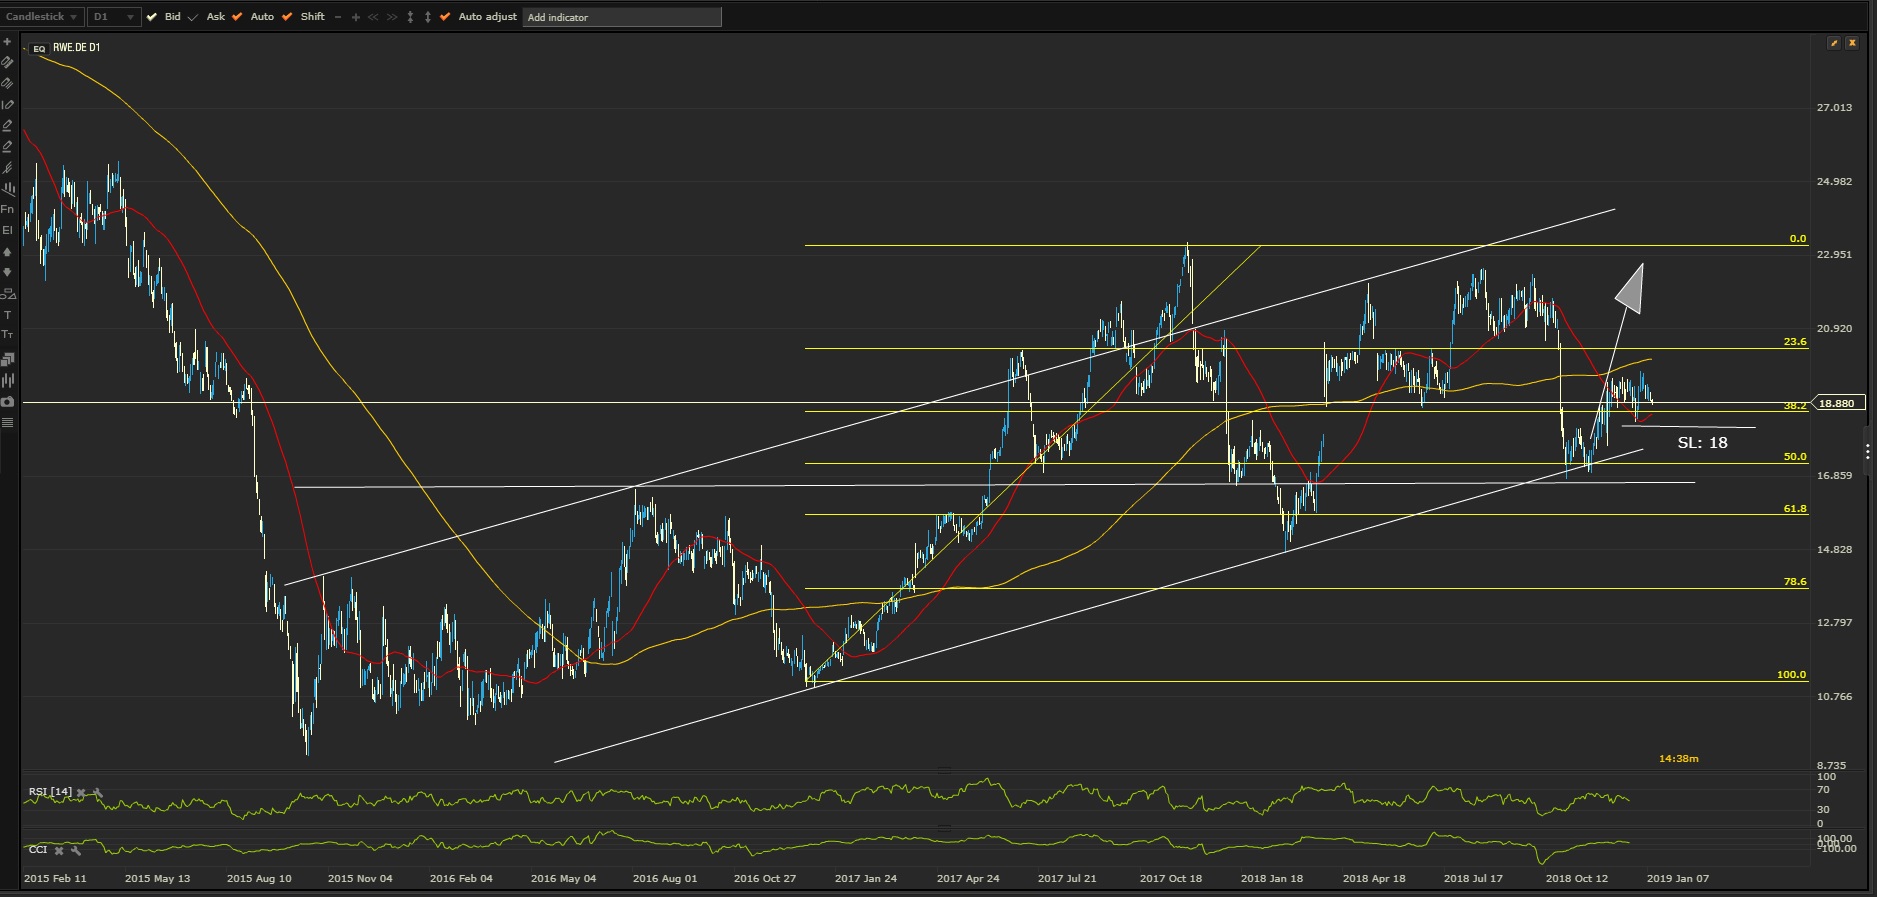
RWE.DE Daily Chart Our Expectations: Long trend, Correction to Basic Horizontal and Diagonal. The price goes back north with the trend
Comment: Long trend. Correction to basic horizon and diagonal. Breakthrough of 38.2% Fibonacci. The price is forming higher tops and bottoms. RSI14 on neutral territory. Breakthrough 50SMA, the price stays above.
SL: 18
Alternative Scenario: If the price breaks and falls below support, the correction may be deeper by following a 61.8% Fibonacci test. Breakthrough there will ruin this scenario and send the action to the sword territory.
 Trader Georgi Bozhidarov
 Read more:


RECCOMEND
WAS THIS POST USEFUL FOR YOU?
If you think, we can improve that section,
please comment. Your oppinion is imortant for us.
If you think, we can improve that section,
please comment. Your oppinion is imortant for us.

