

- Home
- >
- Fundamental Analysis
- >
- Signs of impending recession are increasing

Signs of impending recession are increasing
Rating:

Wall Street still exudes widespread optimism that 2017 will provide another year of solid if unspectacular economic growth and only gentle interest rate rises.
With the S&P 500 up over 4 per cent for the year, here is a series of charts that will hearten investors of a more bearish persuasion. While there are good reasons why each chart should each be taken with a pinch of salt, together they indicate that any ebullience should probably still be tempered.
One of the main factors sustaining this year’s stock market rally, despite fading hopes over growth-friendly policies from the Trump administration, has been the global economy’s purple patch, with investors hailing signs of the first synchronised international expansion spurt in many years.
But after climbing to multiyear highs earlier in 2017, Citi’s Economic Surprise indices —
This is especially true for the US gauge, after poor readings on job creation, inflation, housing starts and auto sales.

US corporate lending has also been unexpectedly weak, raising eyebrows among economists.
Here is a chart from Goldman Sachs showing the growth of commercial and industrial loans has sagged sharply recently, while corporate debt servicing costs have been climbing to more normal levels reflecting rising indebtedness and the Federal Reserve’s interest rate increases. Goldman’s economists point out that debt servicing costs are likely to continue to rise, given the central bank’s plans to tighten monetary policy further.

The consumer lending side is also looking less than ideal, with man)' households and individuals struggling with big student loans, credit card debt and car loans, after a period of anaemic wage growth. Signs of some stresses can be seen in the uptick in S&P/Experian’s bank card default rate.

Even the default rate on high-quality “prime” loans edged up in the last quarter of 2016, according to the Mortgage Bankers Association.

Meanwhile, one of the most accurate measures of looming recession risk is the bond market “yield curve” shaped by bonds of various maturities flattening or even inverting. The US yield curve is far from inverting, but it has flattened sharply again this year, after steepening in the wake of the US election last November.
The difference between two and 10-year US Treasuries this week compressed below 100 basis points for the first time since November, and many analysts expect it to flatten further as the Fed keeps raising interest rates.

Returning to equities, fading analyst optimism over US “small-caps” — smaller listed companies beyond blue-chip gauges like the S&P 500 — is another warning sign. Small-caps are the bedrock of corporate America, and were at the epicentre of the post-electio “Trump trade”, due to their mainly domestic businesses that would be shielded from a stronger dollar, and high effective tax rates that the new president promised to slash. But the Russell 2000 small-caps index has been treading for most of 2017, and analysts have taken a chainsaw to their small-caps earnings forecasts.

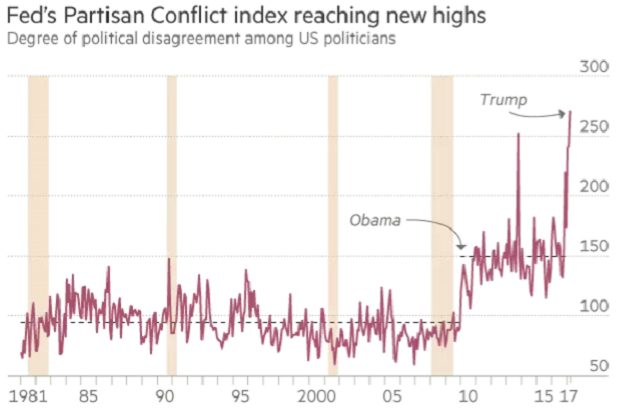
Lastly, the rancorous US political climate shows no signs of abating. Here is a chart of the Philadelphia Fed’s “partisan conflict” index, which tracks the degree of political disagreement among federal-level politicians by measuring the frequency of newspaper articles that report disagreements in any given month. The shaded areas denote recessions.

Source: Financial Times
Jr Trader Petar Milanov
 Varchev Traders
 Read more:


If you think, we can improve that section,
please comment. Your oppinion is imortant for us.

