

- Home
- >
- Commodities Daily Forecasts
- >
- Soybean – good levels for a trend following long entry

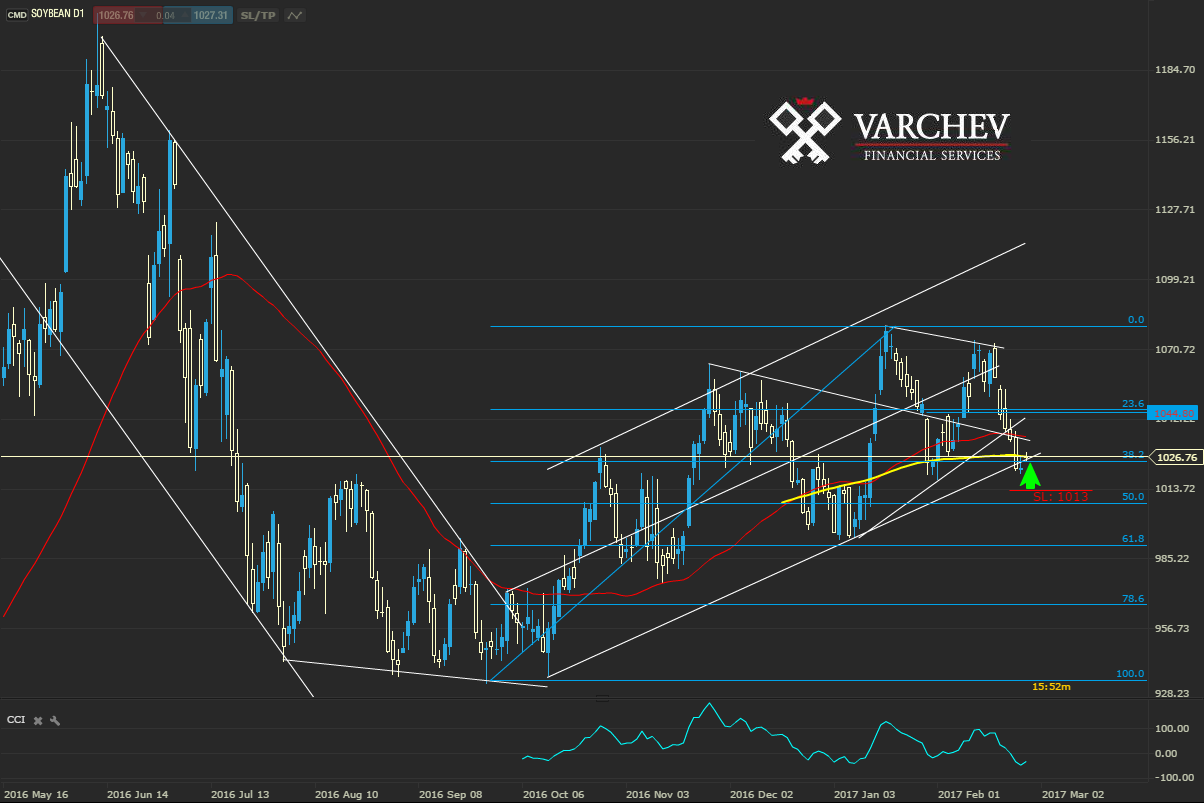
Soybean - good levels for a trend following long entry
Rating:

Soybean: 27.07.2017
Timeframe: D1
Downtrend movement with fake breakthrough the trend bottom diagonal, Fibo 38.2% and SMA200.
On the H4 timeframe chart we have a "double bottom" formation and CCI 50 indicator crosses above -100 which is positive signal.

Price Action: Reversed Hammer - signal for end of the correction and new uptrend movement
Technical Indicators:
SMA50/200 - SMA50 is under SMA200 - positive sentiment. Price has made a fake breakthrough the SMA200 - buy signal.
CCI50 - in negative zone, but going to cross above 0 - still doesn't give a clear signal.
SL: 1013
Alternative scenario: if price goes back below the diagonal support and hold there then we can expect a new downtrend movement.
Jr_Trader_Ivan_Ivanov
 Varchev Traders
RECCOMEND
WAS THIS POST USEFUL FOR YOU?
If you think, we can improve that section,
please comment. Your oppinion is imortant for us.
If you think, we can improve that section,
please comment. Your oppinion is imortant for us.

