

- Home
- >
- Stocks Daily Forecasts
- >
- S&P 500 Technical View Into Year’s End

S&P 500 Technical View Into Year's End
Rating:

Last week’s pre-holiday range of nineteen handles in the S&P 500 futures (ESH18) was the smallest range in the past several weeks; and while the ESH18 was able to make new all-time highs early in the week, the rest of the week this market was sideways, unable to build on those highs or finally print the big 2700 level, reaching a high at 2698.
Going into this week, the historical stats between Christmas and New Year’s Day are very strong for equity markets. In addition, the volume is most likely expected to be low until Friday’s final trade of the year as traders take their time returning to their desks following the holiday.
This type of price action usually favors the upside, which supports our usual outlook to buy small dips remains this week, or at least through Thursday.
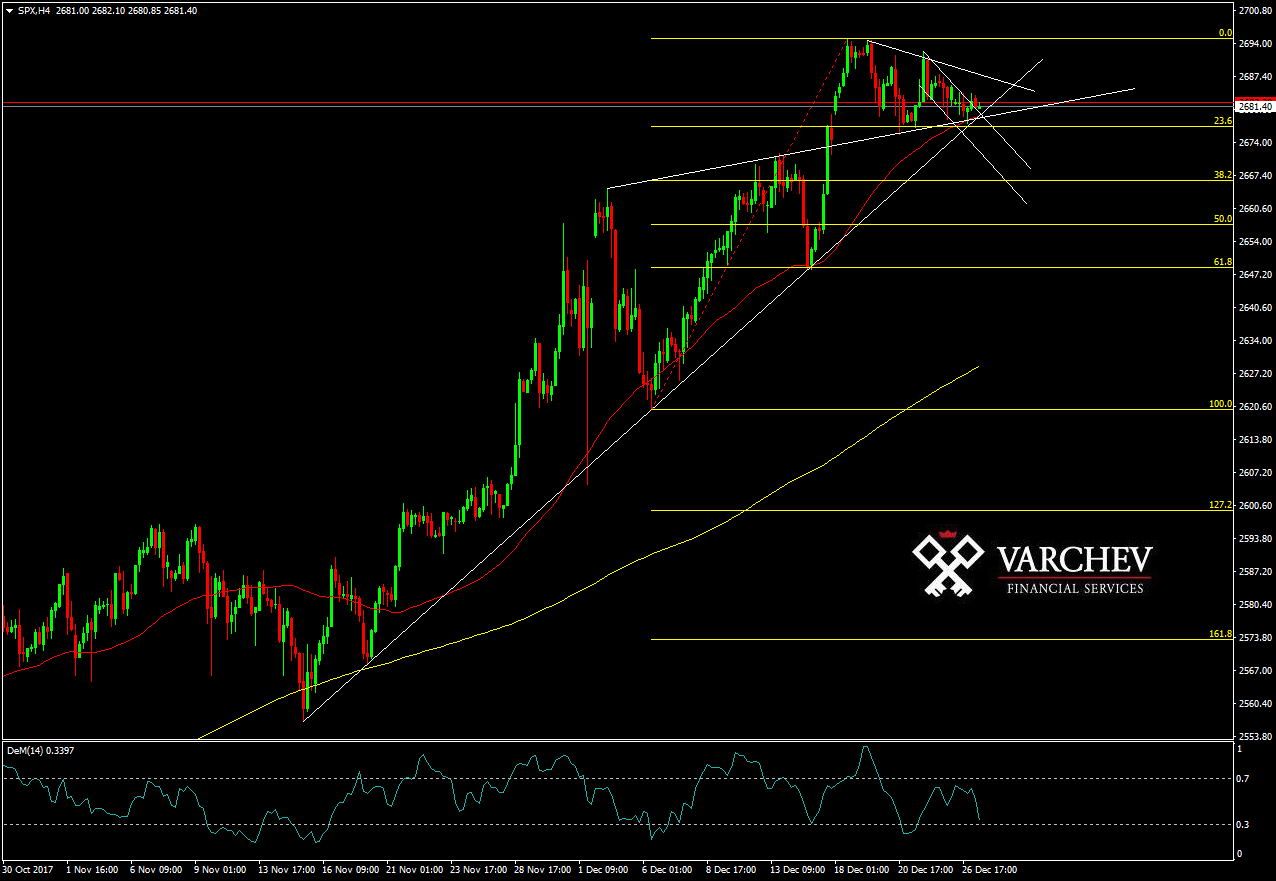
We will take a look at the S&P 500 futures on the two-hour chart below, which spans the past couple of weeks, to present our technical view.

First, we will examine the upside. The upper green trendline shows resistance at 2694. We consider this resistance level relatively minor and would look next to the 2698 high from last week and then the big round 2700 target. On any longs, we would take some profit into these levels.
Our weekly target is broader than usual on our Fibonacci extensions due to last week’s quiet range, so we are targeting the 50% extension of last week’s range which is at the 2708.00 area. Just to note, the 100% extension of last week’s range is at 2718.00 and we are not expecting a trade to that area.
To the downside, the green lower trendline has been an important trend marker over the last couple of weeks but is now failing. The first target below that line for market bears would be last week’s 2679 low, marked in orange, where aggressive longs will be willing to buy. The next level below that would be the yellow line at 2673 where one-time resistance may become support. This would also mark a 25-handle pullback from the all-time high.
If these levels do not prompt buyers, we would first look for a move to the 100% extension of last week’s range, shown in blue at the 2660.00 area, and then to the two-week low at 2651.75 in lavender, which would represent a 1.75% pullback from last week’s high.
Source: North America Derivatives Exchange
Jr Trader Alexander Kumanov
 Varchev Traders
 Read more:


If you think, we can improve that section,
please comment. Your oppinion is imortant for us.

