

- Home
- >
- Stocks Daily Forecasts
- >
- S&P at support levels, signal for a upward impulse

S&P at support levels, signal for a upward impulse
Rating:

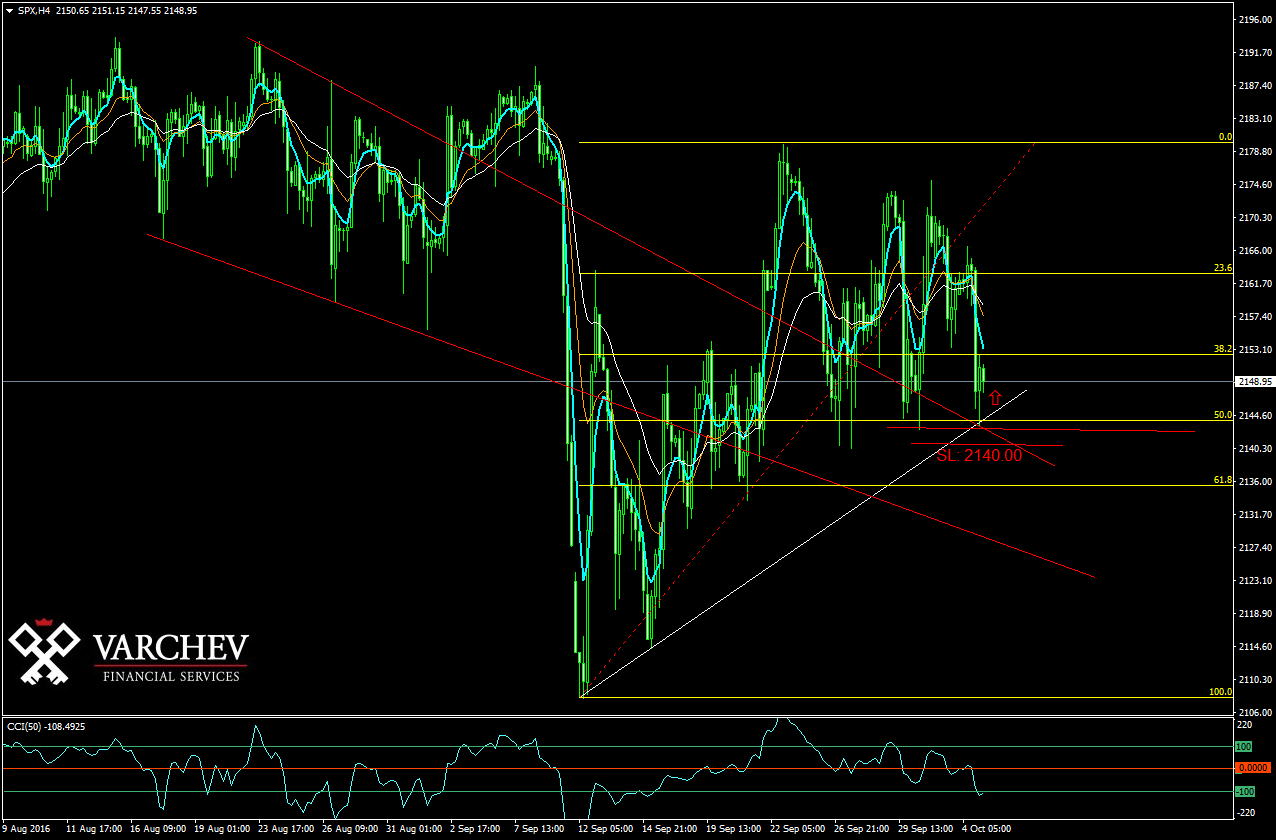
S&P 05.10.2016
H4 chart
Long-term and mid-term upward tend, short-term consolidation. Price made a correction to levels of horizontal and diagonal support and Fibo 50.0. The correction at the last bullish pin bar(50%), which give us a opportunity for closer SL.
Price action signal - Pin bar at levels of horizontal and diagonal support
Technical Indicators:
CCI(50) - In overbought area and turning - at a breakthrough at -100, the upward impulse will increase.
SL: 2140.00
Alternative scenraio: If the price goes below the horizontal and diagonal support, the negative scenario will change toward positive and a new upward movement may occur.
Jr_Trader_B_Arabadzhiev
 Varchev Traders
RECCOMEND
WAS THIS POST USEFUL FOR YOU?
If you think, we can improve that section,
please comment. Your oppinion is imortant for us.
If you think, we can improve that section,
please comment. Your oppinion is imortant for us.

