

- Home
- >
- Uncategorized @en
- >
- S&P: Short move likely to continue

S&P: Short move likely to continue
Rating:

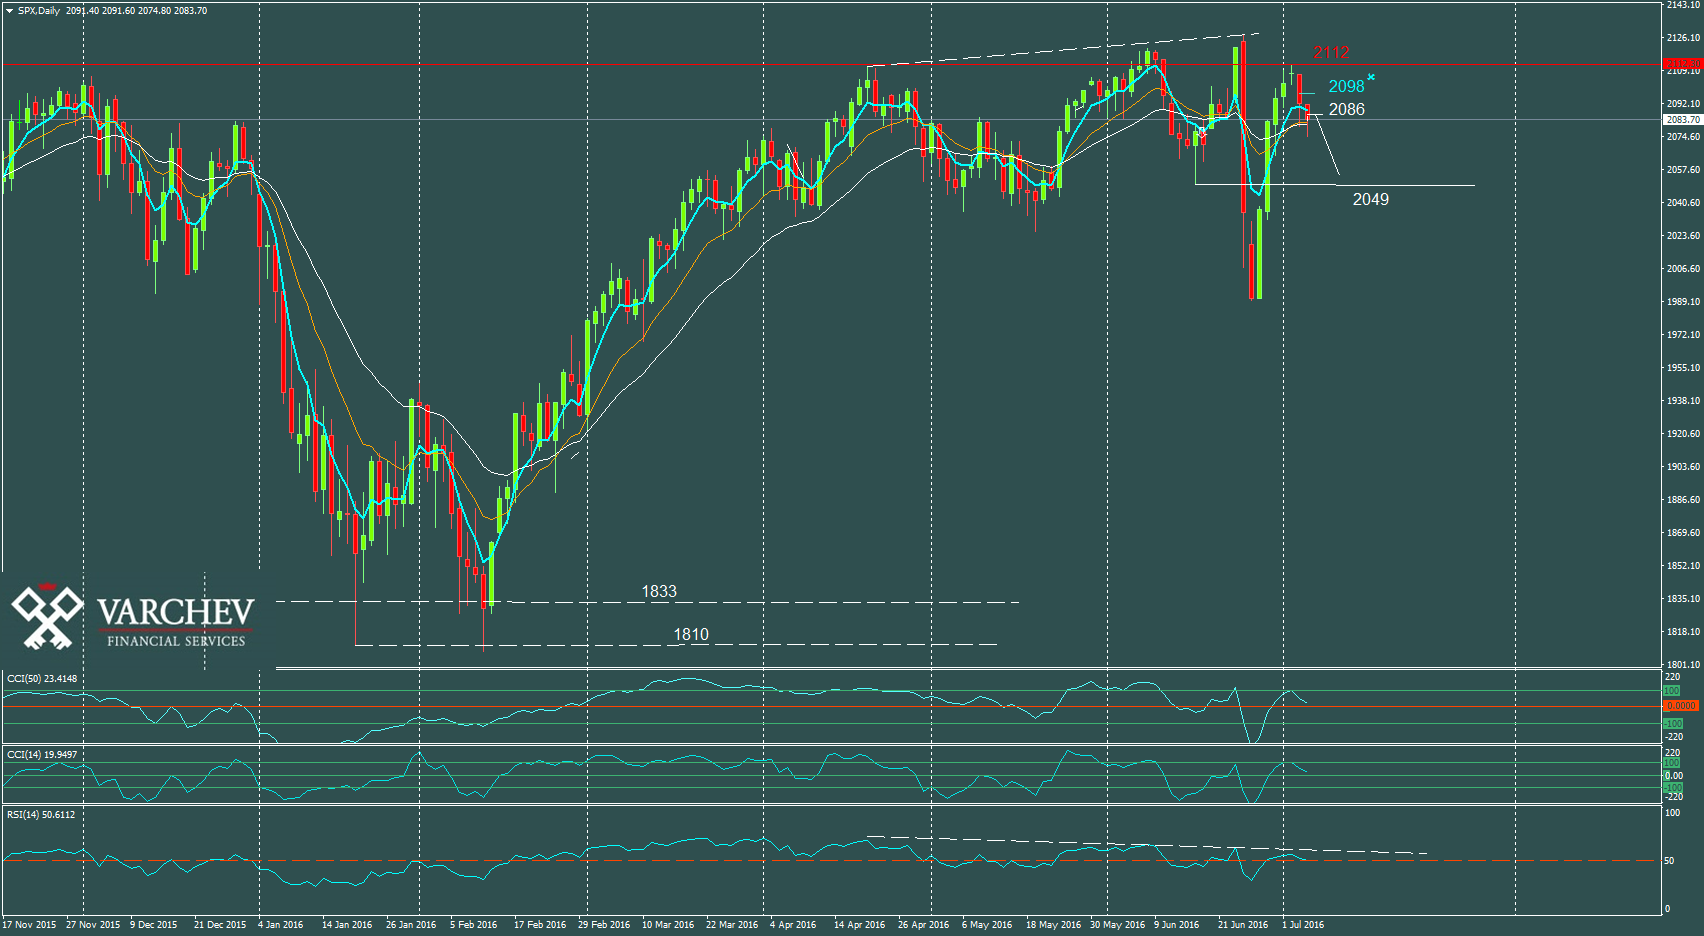
S&P 500: Daily chart, Choppy market for the last 2 years, the price is at the upper part of the consolidation. Price is at a level of resistance 2112. Price action: formation "Evening star" - bearish reversal. Triple divergence: Higher highs of the prices but lower highs of the RSI indicator, CCI (50) moves below 100 - possible move lower from here on H4 Chart. Lower high - possible change in the direction to short. Price Action signal: Engulfing bar. 
Correction about 50% of the Engulfing bar - good levels for a new short 2086. RSI Indicator is below 50, at the moment when the price moves below the 25 EMA - Negative signal.
Stefan D. Angelov - Head of Stocks Trading
 Varchev Traders
 Read more:


RECCOMEND
WAS THIS POST USEFUL FOR YOU?
If you think, we can improve that section,
please comment. Your oppinion is imortant for us.
If you think, we can improve that section,
please comment. Your oppinion is imortant for us.

