

- Home
- >
- Stocks Daily Forecasts
- >
- SPX is going for a major resistance

SPX is going for a major resistance
Rating:

SPX
Time frame: H4
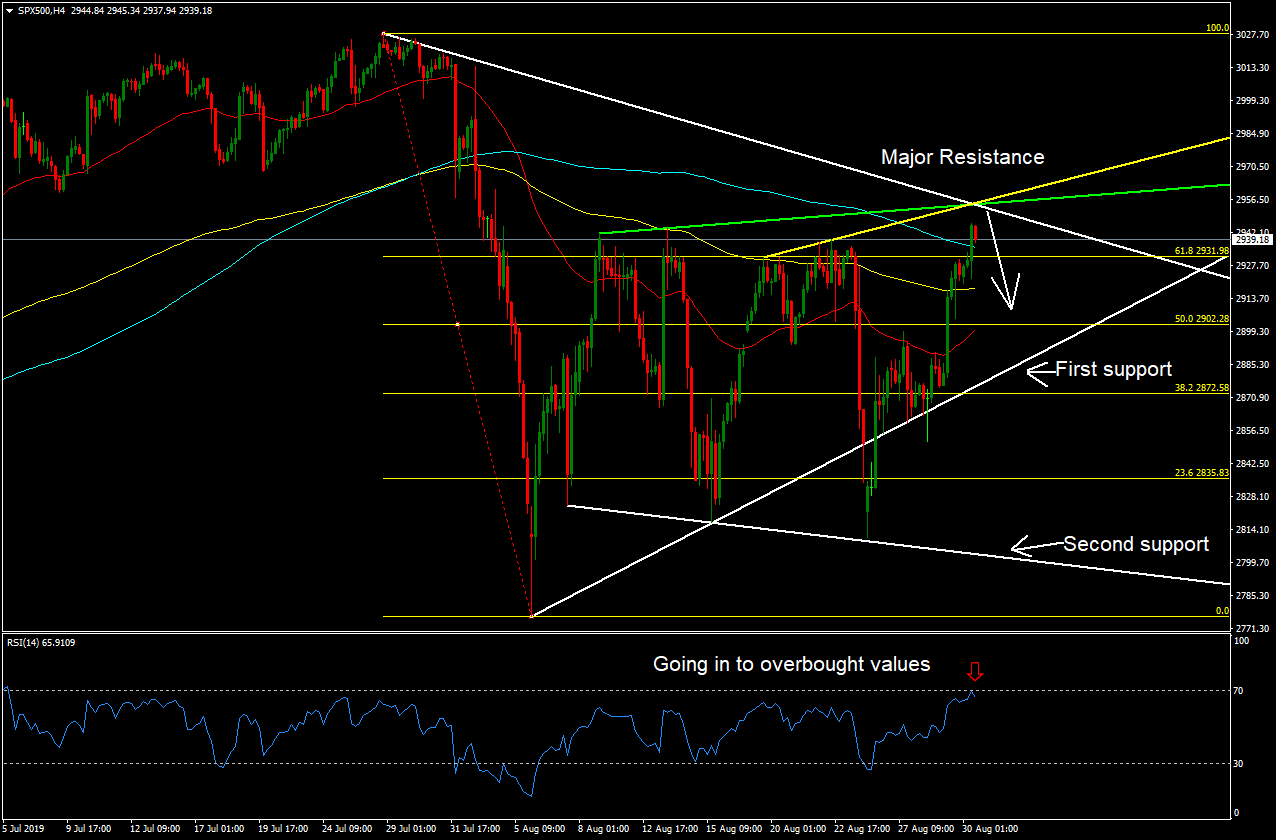
Technical analysis: The chart shows that the price of SPX is in a short-term downward trend since the beginning of August. After making a low at 2780, the index headed north, reaching Fibonacci 61.8. This level was a strong resistance to the price, which led to three consecutive declines. During these downturns, it made three consecutive bottoms, which respectively formed a divergence and sent the index again north.
Currently, the price has broken the main resistance at 61.8% and 200 periodic SMA, thus paving the way for the last and strongest resistance. It consists of three diagonal trend lines drawn from the tops of the consolidation and from the tops of the previous downturn. If the price manages to reach it, we can see another downward movement.
Indicators: At this stage, all moving averages play a supportive role.
RSI is entering over-sold territory, which supports sales as they reach last resistance.
Alternative scenario: If the price breaks resistance then we can see a rise to the previous peaks around the 3030 level.
 Trader Milko Zashev
 Read more:


If you think, we can improve that section,
please comment. Your oppinion is imortant for us.

