

- Home
- >
- Stocks Daily Forecasts
- >
- Stock Market Crash? It’s Coming, and This Chart Shows How It Will Unfold

Stock Market Crash? It's Coming, and This Chart Shows How It Will Unfold
Rating:

Stock Market Crash? It's Coming, and This Chart Shows How It Will Unfold
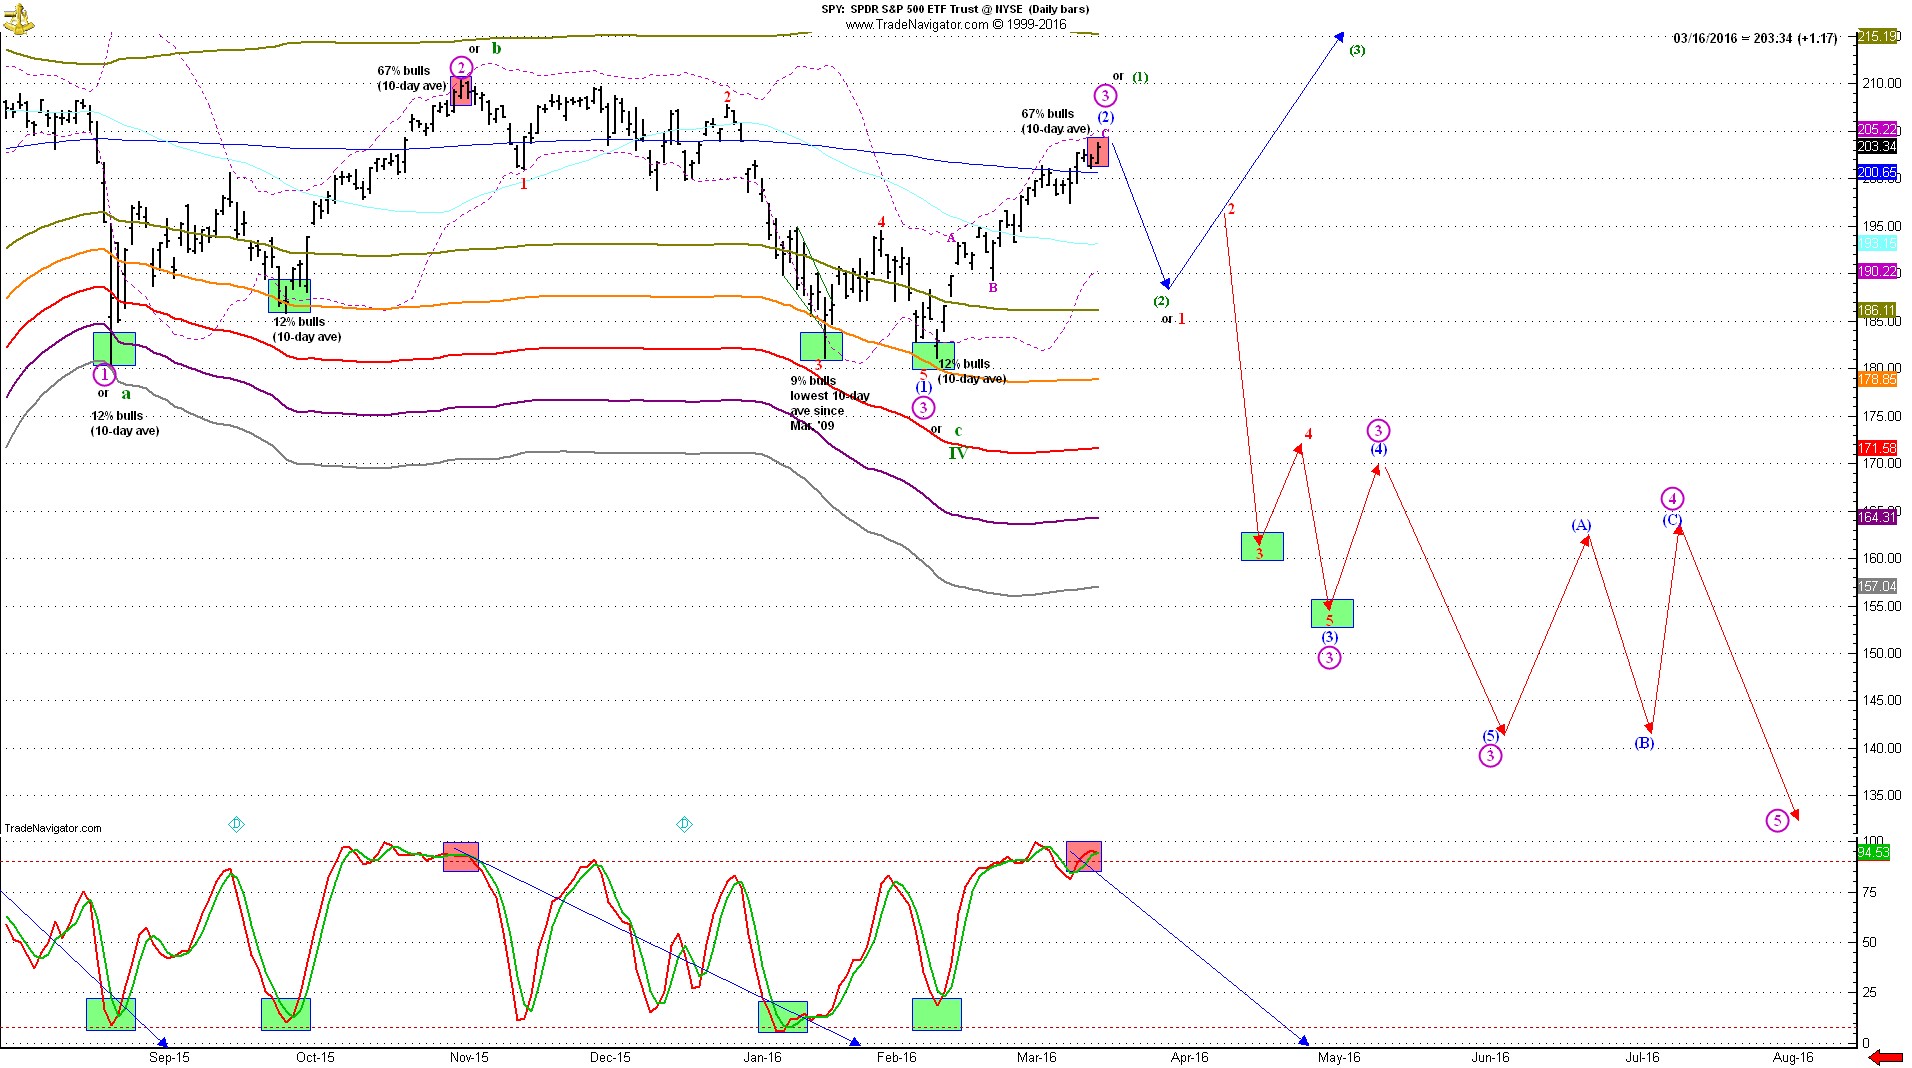
Let's just get it out of the way: There's a big elephant in the room, and it looks like early November. If you don't remember what happened back then, the daily bar chart below will remind you. It shows the SPDR S&P 500 ETF Trust (SPY) , an exchange-traded fund that tracks the S&P 500 index.

By Nov. 3, that bearishness had reversed and where there were no bulls at the 12% level. Now there were 67%, on the same 10-day smoothing. Price had also risen to the upper Bollinger Band, and in a large up/down/up corrective pattern. Then, the rally-killer appeared: the red boxes showing the higher high in price vs. the lower high in stochastics.
Note how the market's condition right now is similar to its condition at the November high. You can compare the red box at the upper right with the red box in November. In both instances, there are 67% bulls readings on a 10-day smoothing basis. In both instances, prices are bumping up against the upper Bollinger Band. In both instances, stochastics are making lower highs while stock prices are making higher highs. In both instances, there are very large upward/corrective patterns of up/down/up cadence. In both instances, there is no evidence of an objective buying opportunity.
 Varchev Traders
 Read more:
 Peter Boockvar: Stocks to retest correction lows as easy money disappears
 Investors target ‘buyback stocks’ in bet on Trump tax plan
 Europe markets lower as geopolitical concerns deepen
 There may be a ‘fantastic’ buying opportunity after the New Year, expert says
 How much market experts expect stocks to rise next year
If you think, we can improve that section,
please comment. Your oppinion is imortant for us.

