- Home
- >
- Daily Accents
- >
- Stocks are healthy enough to rally without tech

Stocks are healthy enough to rally without tech

There is a lot of chatter now that investors and money managers are too enamored with the leading technology stocks. While it does appear to be a very crowded trade, making these stocks vulnerable to a sharp pullback, the market as a whole is quite capable of keeping the bull trend going.
Two of the tech-related stocks portfolio managers are heavily overweighted in are Aphabet Inc. and Amazon.com Inc.
Not only did the Dow Jones Industrial Average DJIA trade at all-time highs this week, but it got a lot of help from many sectors and all sizes of stocks. In other words, market breadth is deceptively strong so even if the leaders stumble, the market should survive.Breadth is a measure of how many stocks are participating in the market’s move. The best analogy is that there are generals, such as Facebook Inc. that lead the charge. However, the market cannot win for long unless these stocks are followed by the rest of the soldiers.
The “generals” were responsible for a huge portion of the overall market’s gains this year until they fell sharply in early June. But if we look at the S&P 500, which is heavily weighted in those leading tech stocks, there was barely a hiccup. The reason can only be that other stocks rallied as those tech stocks fell. Measures of breadth include the net number of stocks going up each day, net new 52-week highs, and the percentage of stocks trading above their 200-day averages. Of course, there are much more ways to slice and dice the market, but this is a great starting point.
The important point to remember is that breadth typically peaks with or ahead of a price peak. We’ve heard the old saw that market bottoms are events and market tops are processes. Basically, at a top, sector after sector starts to roll over as the market slowly succumbs. That is clearly not the case right now. The advance-decline line keeps a running total of stocks that go up each day minus stocks that go down. The theory is that when the market rallies, more stocks should rally than decline and the advance-decline plot moves higher. When the plot starts to decline even as prices rise, we surmise that the “soldiers” aren’t pulling their weight. Eventually, this will become a drag on the S&P 500 and other indexes and they will stumble.
As we can see in the chart, the advance-decline for the New York Stock Exchange is a solid rising trend and hit an all-time high this week.
While not quite as reliable as in indicator, the advance-decline for the Nasdaq Composite Index is also in a solid rising trend at new highs. The reason I say it is not as reliable is that the Nasdaq is home to a lot of smaller, speculative companies that don’t stay in business. That can give this indicator a natural negative bias. In a bull market, obviously, it is good when many stocks hit new 52-week highs. Typically, we look at the difference between new highs and new lows, and that chart looks similar to the advance-decline chart with a strong rising trend. However, when we look at a market trading near all-time highs it is a good idea to just look at new highs alone. Right now, the New York Stock Exchange averages 133 new highs each day or about 4% of all issues traded, and that is good. However, if it starts to head much lower (perhaps to single digits) as the market moves higher, it would raise a red flag. Again, that is not the case today. Chartists look at the percentage of stocks that are above various moving averages, and the most important are the 200-day average. Here, trading above this average tells us that the stock is in a primary rising trend and the more stocks that are, the better for the market. That is, to a point.
Similar to a momentum indicator, we want to see this percentage in the 60%-80% range. When the percentage of stocks in strong rallies is much higher, the market could be getting overbought. Put another way, if all stocks are already in strong rallies, there are no stocks left to join in, and that means a greater risk that the market is nearing a peak.
Right now, the NYSE sports a reading of 69%. That is within the bullish range and it supports the case that market breadth is good. For the bulk of 2017, large-cap stocks have been the primary market leaders, but Andrew Thrasher, the portfolio manager at Financial Enhancement Group, points out that recently there’s been an improvement below the surface for small-cap stocks.
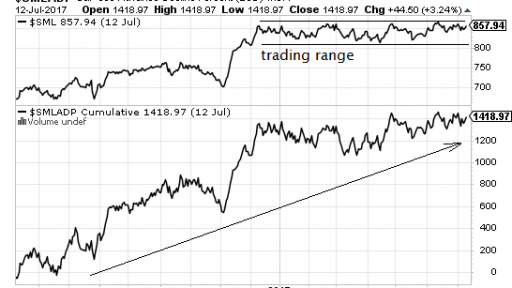
Specifically, he sees the advance-decline line for the S&P 600 small-cap index showing more strength than earlier in the year:
The S&P 600, as well as the Russell 2000 index of small-cap stocks, has finally broken out from its trading range. This is the last major piece of the bullish puzzle. This finally confirms the power that exists all across the market.
With breakouts in financials and industrials and solid rising trends in health care and basic materials, the rally is broad and deep enough to keep going even if another tech pulls back emerges.
The caveat is that it has been a long time — more than a year — since the last meaningful market pullback of 5% or more. And even if that happens sooner rather than later, it will result in a dip down to the lows of March and April of this year for both the S&P 500 and Russell 2000 index.
Source: Bloomberg Pro Terminal
Trader - S. Fuchedzhiev
 Varchev Traders
 Read more:
If you think, we can improve that section,
please comment. Your oppinion is imortant for us.


