

- Home
- >
- Opportunities for profit today
- >
- Suitable level for long position

Suitable level for long position
Rating:

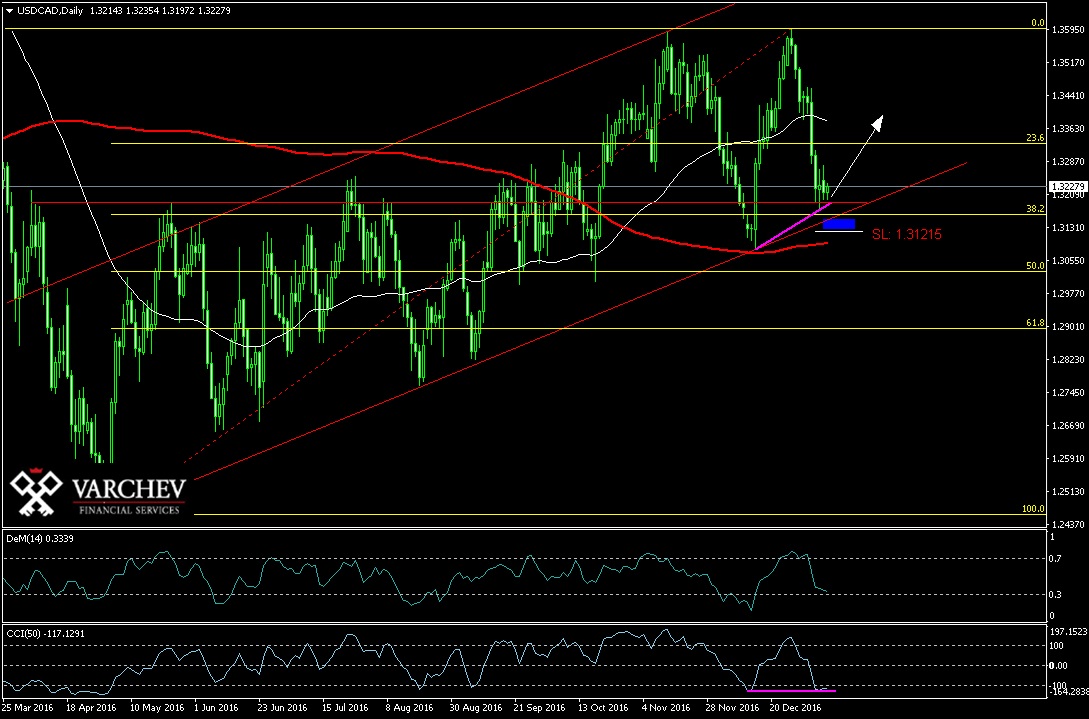
USDCAD: 10.01.2017 D1 chart.
Uptrend on daily chart.
Price above diagonal and horizontal supports and close above 38.2% Fibo level.
Price Action: Doji bar and price holding above horizontal support on level 1.319
Technical Indicators:
DeM – Close to level 0.3 expected to turn up – positive signal.
CCI (50) – Gives conflicting signals. Level below 0 – negative signal. Divergence according to the bar chart – positive signal.
Price above SMA 200 – trend substaining signal.
SL: 1.31215
Alternative scenario: If the price breaks below horizontal or diagonal supports or 38.2 Fibo level, this probably will lead to correction and test to SMA 200 or 50% Fibo level.
 Varchev Traders
 Read more:
 It seems Trump has completely confused Bank Of Canada’s plans
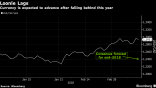
 The currencies of the countries with the biggest GDP improvement rally – CAD, NOK, SEK
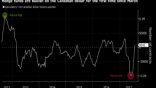 Hedge Funds Wager Loonie Rally Has Legs as Market Turns Bullish
 CAD: The currency is to strengthened even more, with looming BoC meeting
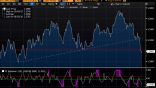 Massive CAD short Squeeze as investors turn neutral on USD
RECCOMEND
WAS THIS POST USEFUL FOR YOU?
If you think, we can improve that section,
please comment. Your oppinion is imortant for us.
If you think, we can improve that section,
please comment. Your oppinion is imortant for us.

