

- Home
- >
- Stocks Daily Forecasts
- >
- Technical chart analysis shows DJIA’s long-term target is 21,000 but resistance in the way

Technical chart analysis shows DJIA's long-term target is 21,000 but resistance in the way
Rating:

The Dow Jones industrial average's breakout above 18,300 is significant, but it is also weak.
The weakness is confirmed both with chart and fundamental analysis.
Firstly, the Dow chart has two significant chart patterns that combine to limit the Dow rally in the short term.
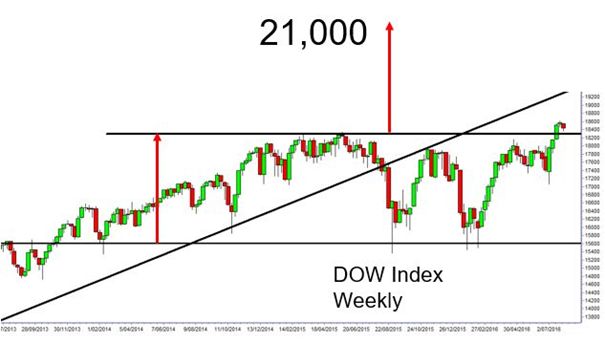
The first feature is the well-established trading band. The lower edge of the trading band is near 15,600, the upper edge is near 18,300. The width of the trading band is measured and then projected upwards, giving a target near 21,000.
This is a long-term target, and the Dow is making new highs, but there are technical chart features that will limit the way the Dow moves to hit that target.
Here's how it works. The second feature on the Dow chart is a long-term uptrend line, starting in October 2011. To understand the significance of this trend line we need to understand the way trend lines change polarity or function. between October 2011 October and August 2015 the uptrend line acted as a support level. The Dow would pull back to this level, then rebound and continue the uptrend.
In August 2015 the DOW moved below the uptrend line. Many people believe that when this happens it means a new downtrend starts, but they're wrong. It means the nature of the trend has changed and with the DOW specifically it means the trend line has changed polarity and now acts as a resistance line.
When the Dow rallied in November 2015, the trend line acted as a resistance level, and when projected into the future it will continue to act as a resistance level.
When these two features are combined, it provides information on how the Dow breakout will develop. Using long-term trend line will act as a resistance level, the current breakout has an upside target near 19,350, which is near the current value of the trend line. There is a high probability the Dow will retreat and retest the upper edge of the trading band near 18,300 before a rebound rally moves up to test the trend line as a resistance level.
The Dow breakout is bullish, but the value of the trend line limits the upward momentum and slows the progress towards the long-term 21,000 target.
 Varchev Traders
 If you think, we can improve that section,
please comment. Your oppinion is imortant for us.

