

- Home
- >
- Daily Accents
- >
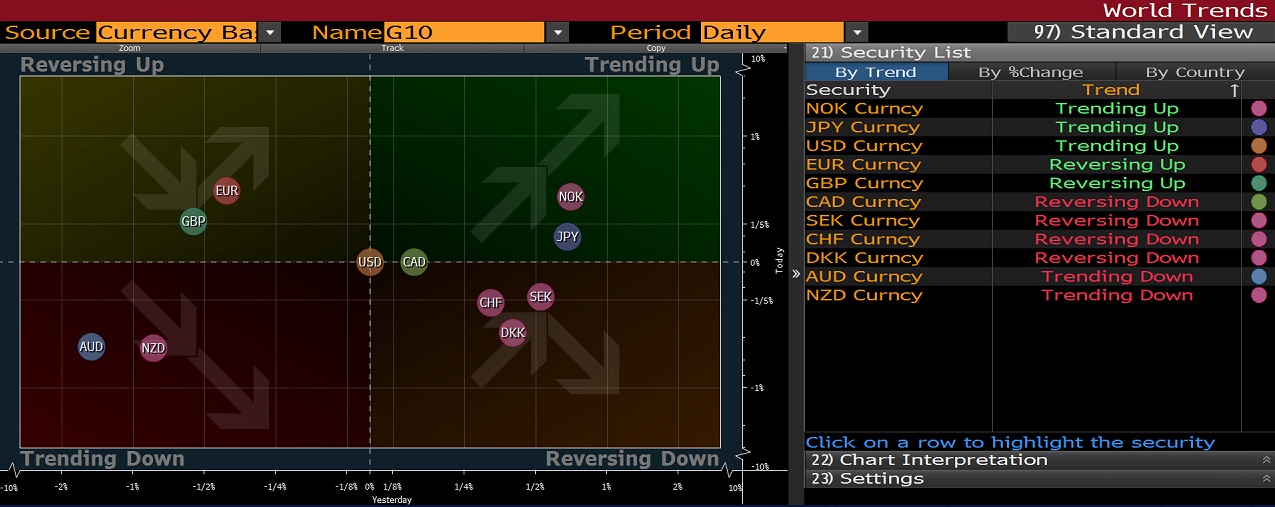
- Technical levels for the major currencies today on 04/05/2017

Technical levels for the major currencies today on 04/05/2017
Rating:

* EUR/JPY -- Breaking March highs at 122.89
* 3rd resistance: 123.86, Dec. 30 high
* 2nd resistance: 123.73, Jan. 9 high
* 1st resistance: 123.31, Jan. 27 high
* Spot: 123.27
* 1st support: 122.32, May 3 low
* 2nd support: 122.09, May 1 high
* 3rd support: 121.86, May 2 low
* USD/JPY
* 3rd resistance: 113.26, 100-DMA
* 2nd resistance: 113.00, YTD channel top
* 1st resistance: 112.87, ichimoku cloud top
* Spot: 112.85
* 1st support: 112.37-31, May 3 mid price, May 2 high
* 2nd support: 111.97, May 3 low
* 3rd support: 111.82-78, 55-DMA, May 2 low
* AUD/USD -- Next major line of defense at 0.7385
* 3rd resistance: 0.7480, May 3 mid open/close price
* 2nd resistance: 0.7462, May 1 low
* 1st resistance: 0.7440, April 27 low
* Spot: 0.7402
* 1st support: 0.7385, 61.8% Fibonacci of Dec./March rise,
Jan. 1 high
* 2nd support: 0.7352, Jan. 11 low
* 3rd support: 0.7331, Jan. 10 low
* NOK/SEK -- Inching toward breakdown line at 1.02
* 3rd resistance: 1.0308, May 2 high
* 2nd resistance: 1.0278, May 1 low
* 1st resistance: 1.0267, May 3 high
* Spot: 1.0211
* 1st support: 1.0206, pivot s1
* 2nd support: 1.0199, April 26 low
* 3rd support: 1.0143, Aug. 23 low
* EUR/USD -- Overlapping sessions against 1.0934 Fibonacci
warns at downside corrective risks
* 3rd resistance: 1.1070-74, weekly cloud, 76.4% Fibonacci
* 2nd resistance: 1.0995, 100-week MA
* 1st resistance: 1.0951-54, April 26, Nov. 10 high
* Spot: 1.0919
* 1st support: 1.0857-52, April 28, 27 low
* 2nd support: 1.0833, 200-DMA
* 3rd support: 1.0821, April 24 low
* EUR/NOK
* 3rd resistance: 9.4745, Aug. 3 high
* 2nd resistance: 9.4657, pivot r2
* 1st resistance: 9.4428, Aug. 8 high
* Spot: 9.4366
* 1st support: 9.3970, May 2 high
* 2nd support: 9.3697 May 3 low
* 3rd support: 9.3300, May 1 low
* GBP/USD
* 3rd resistance: 1.2966-69, May 1 high, 55-week MA
* 2nd resistance: 1.2948, May 3 high
* 1st resistance: 1.2894, daily pivot
* Spot: 1.2886
* 1st support: 1.2805, April 26 low
* 2nd support: 1.2773, April 24 low
* 3rd support: 1.2757, April 21 low
*EUR/GBP -- Gap zone 0.8405-0.8387
* 3rd resistance: 0.8531, April 26 high
* 2nd resistance: 0.8496, April 27 high
* 1st resistance: 0.8485, May 2 high
* Spot: 0.8472
* 1st support: 0.8423, May 2 low
* 2nd support: 0.8405, April 28 low
* 3rd support: 0.8387, April 21 high
* USD/CHF -- Consolidates inside wide range of April 24
* 3rd resistance: 1.0000-09, April 21 high, April 13 low
* 2nd resistance: 0.9967, May 2 high
* 1st resistance: 0.9957, Asia high
* Spot: 0.9925
* 1st support: 0.9891, May 3 low
* 2nd support: 0.9856, April 24 low
* 3rd support: 0.9832, March 28 low
 Varchev Traders
 Read more:
 And for all the bounty hunters: Iran offers $80m for the head of Donald Trump
 US service member and 2 US Defense Dept contractors killed in Kenya attack
 Iranian Quds leader Qasem Soleimani has been killed – how are markets reacting
 A calm end of an otherwise loud 2019
 Old but Gold – Top 5 posts of Varchev Finance
If you think, we can improve that section,
please comment. Your oppinion is imortant for us.

