

- Home
- >
- FX Daily Forecasts
- >
- Technical levels of the major currency pairs today 06/09/2017

Technical levels of the major currency pairs today 06/09/2017

Rating:

* EUR/USD -- Gradual rollover process consistent with diverging momentum readings
* 3rd resistance: 1.1300, Nov. 9 high
* 2nd resistance: 1.1285, June 2 high
* 1st resistance: 1.1237, Asia high
* Spot: 1.1185
* 1st support: 1.1179, 21-DMA
* 2nd support: 1.1165, May 31 low
* 3rd support: 1.1110, May 30 low
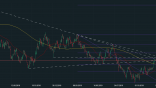
* GBP/USD -- Plunges to equilibrium levels seen at 1.2619-1.2550 (click here for live chart)
* 3rd resistance: 1.2881, 200-hour MA
* 2nd resistance: 1.2847, 61.8% Fibonacci of current range
* 1st resistance: 1.2807, 50% retracement of current range
* Spot: 1.2718
* 1st support: 1.2619-15, 100-DMA, March 27 high
* 2nd support: 1.2596, April 17 high
* 3rd support: 1.2547, ichimoku cloud base
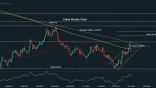
* USD/JPY -- Third day rally lends credence to near-term base formation at 233-DMA -- click here for chart item
* 3rd resistance: 110.96, daily cloud base
* 2nd resistance: 110.73, June 5 high
* 1st resistance: 110.49-53, 200-DMA, June 6 high
* Spot: 110.35
* 1st support: 109.77, Asia low
* 2nd support: 109.38, June 8 low
* 3rd support: 109.12, June 7 low
* AUD/USD -- 100-day average and cloud top (0.7558-59) puts a damper on recent momentum
* 3rd resistance: 0.7611, April 17 high
* 2nd resistance: 0.7592, April 24 high
* 1st resistance: 0.7566-72, cloud, June 7 high, April 25 high
* Spot: 0.7535
* 1st support: 0.7522, June 6 high
* 2nd support: 0.7500, June 7 low
* 3rd support: 0.7457-47, June 6 low, June 2 high
* EUR/NOK -- Consolidates near 2017 highs
* 3rd resistance: 9.6200, Feb. 24, 2016 high
* 2nd resistance: 9.5787, June 7 high
* 1st resistance: 9.5650, pivot r1
* Spot: 9.5335
* 1st support: 9.4921, June 7 low
* 2nd support: 9.4701, June 5 low
* 3rd support: 9.4510, June 1 low
* USD/CHF -- MACD bullish crossover in the works, from depressed levels
* 3rd resistance: 0.9761, May 31 high
* 2nd resistance: 0.9748, 21-DMA
* 1st resistance: 0.9737, May 30 low
* Spot: 0.9715
* 1st support: 0.9661, Asia low
* 2nd support: 0.9638, June 8 low
* 3rd support: 0.9614, June 6 low
* EUR/JPY -- Lengthy topping out process developing
* 3rd resistance: 124.71, June 5 high
* 2nd resistance: 124.19-20, ichimoku baseline, June 5 low
* 1st resistance: 124.03, June 8 high
* Spot: 123.38
* 1st support: 122.63-56, June 7, May 18 lows
* 2nd support: 122.32, May 3 low
* 3rd support: 121.63, 38.2% Fibonacci of April/May rise
* EUR/GBP -- Retreats after printing marginal new YTD high
* 3rd resistance: 0.9025, Nov. 9 high
* 2nd resistance: 0.8991, 61.8% Fibonacci of Oct./Dec. fall
* 1st resistance: 0.8860, Asia high
* Spot: 0.8793
* 1st support: 0.8731, 61.8% Fibonacci of current range
* 2nd support: 0.8701, 76.4% Fibonacci of current range
* 3rd support: 0.8657, Asia low
Source: Bloomberg Pro Terminal
Jr Trader Ivan Ivanov
 Varchev Traders
 Read more:


If you think, we can improve that section,
please comment. Your oppinion is imortant for us.

