

- Home
- >
- FX Daily Forecasts
- >
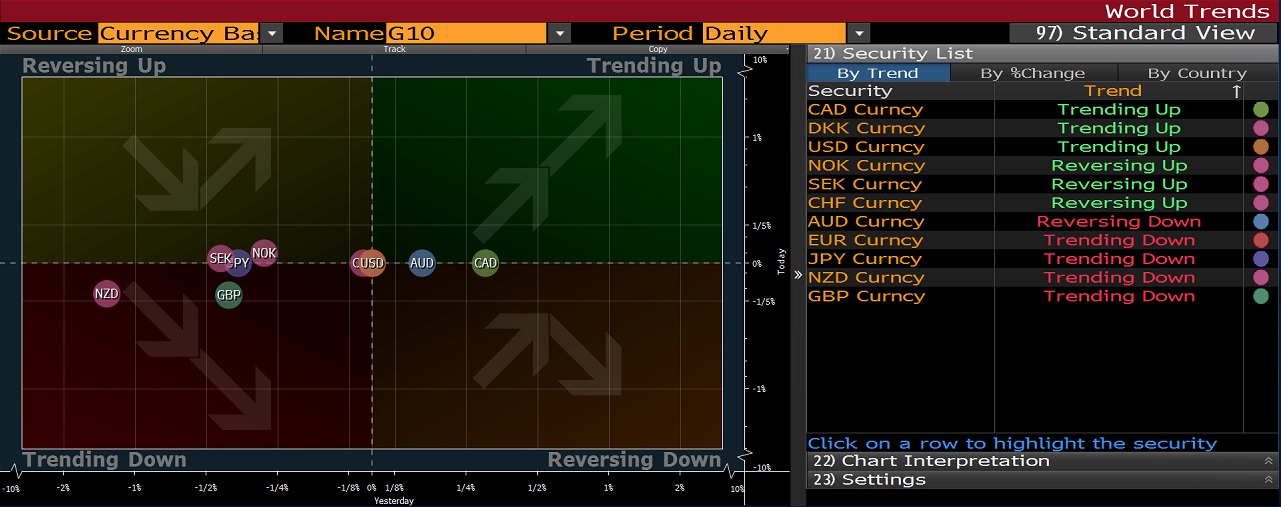
- Technical levels on the major currency pairs today on 12/05/2017

Technical levels on the major currency pairs today on 12/05/2017
Rating:

EUR/USD -- Rebounds after testing 21-DMA for first time in three weeks
3rd resistance: 1.0950, May 5 low
2nd resistance: 1.0933, May 9 high
1st resistance: 1.0893, May 11 high
Spot: 1.0872
1st support: 1.0839-43, May 11 low, 21-DMA
2nd support: 1.0821, April 24 low
3rd support: 1.0778, April 20 high
GBP/USD -- Triple-top below 1.3000 handle defines short-term top as 21-DMA support comes into test
3rd resistance: 1.3055, 38.2% Fibo retracement of Brexit-flash crash drop
2nd resistance: 1.2984-89, series of highs since May 5
1st resistance: 1.2949, May 11 high
Spot: 1.2886
1st support: 1.2850, 21-DMA, May 11 low
2nd support: 1.2831-35, May 4 low
3rd support: 1.2757, April 21 low
AUD/USD -- Weekly close to determine whether bears remain fully in control
3rd resistance: 0.7480, May 3 mid open/close price
2nd resistance: 0.7427-30, May 5-4 highs
1st resistance: 0.7399, May 9 high
Spot: 0.7385
1st support: 0.7329, May 9 low
2nd support: 0.7286, 78.6% Fibonacci retracement of December-March rise
3rd support: 0.7273, Jan. 5 low
EUR/GBP -- Rebounds after filling French first-round vote gap
3rd resistance: 0.8509, May 5 high
2nd resistance: 0.8452. May 11 high
1st resistance: 0.8439, 21-DMA
Spot: 0.8437
1st support: 0.8384, May 10 low
2nd support: 0.8361, 78.6% Fibonacci retracement of April 18-26 rise
3rd support: 0.8337, April 19 low
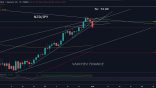
USD/JPY -- Consolidates near recent highs
3rd resistance: 115.51, March 30 high
2nd resistance: 114.60, 61.8% Fibo retracement of YTD drop
1st resistance: 114.37, May 10-11 double-top
Spot: 113.74
1st support: 113.46, May 11 low
2nd support: 113.07, Ichimoku conversion line
3rd support: 111.89, 55-DMA
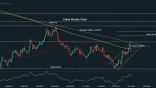
EUR/JPY -- Enters corrective pullback as bullish picture intact for now
3rd resistance: 125.32, 50% retreat of June 2015-June 2016 drop
2nd resistance: 124.59, May 8 high
1st resistance: 124.43, May 11 high
Spot: 123.67
1st support: 123.32, May 11 low
2nd support: 122.93-99, May 5-8 lows
3rd support: 122.29, 23.6% Fibonacci retracement of rise since April 17
USD/CHF -- Needs to overtake April 10 high to establish downtrend reversal
3rd resistance: 1.0171, March 7 high
2nd resistance: 1.0142, 61.8% Fibonacci retracement of drop since December
1st resistance: 1.0107, April 10 high
Spot: 1.0076
1st support: 1.0013, 55-DMA
2nd support: 0.9980, 21-DMA
3rd support: 0.9965-67, May 1-2 double-top
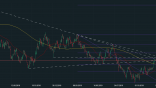
EUR/NOK -- Extends correction since 9.5429, last Fibo resistance of 2016-2017 drop, capped, tests 21-DMA
3rd resistance: 9.5780-5820, May 5-June 24 highs
2nd resistance: 9.4766, May 10 high
1st resistance: 9.3885, May 11 high
Spot: 9.3457
1st support: 9.3270-93, 21-DMA, 50% retreat of gains since April 13
2nd support: 9.2958, April 28 low
3rd support: 9.2343, April 24 low
Source: Bloomberg Pro Terminal
Jr Trader Ivan Ivanov
 Varchev Traders
 Read more:


If you think, we can improve that section,
please comment. Your oppinion is imortant for us.

