

- Home
- >
- Daily Accents
- >
- The best six months for stocks is about to begin

The best six months for stocks is about to begin
Rating:

Odds are that the Halloween Indicator will be especially good for the stock market this year.
That’s encouraging news, since the Halloween Indicator already carries decent odds of success. But when the stock market is riding a wave of momentum into Halloween — as it most definitely is this year, including another 200+ point rally in the Dow Jones Industrial Average DJIA, +1.87% on Thursday — then the odds become even better.
The Halloween Indicator refers to the stock market’s seasonal tendency to produce its best returns between Halloween and May Day (the so-called “winter” months). This indicator is also known as “Sell and May and Go Away,” since those who mechanically follow it go to cash during the “summer” months (from May Day until the subsequent Halloween).
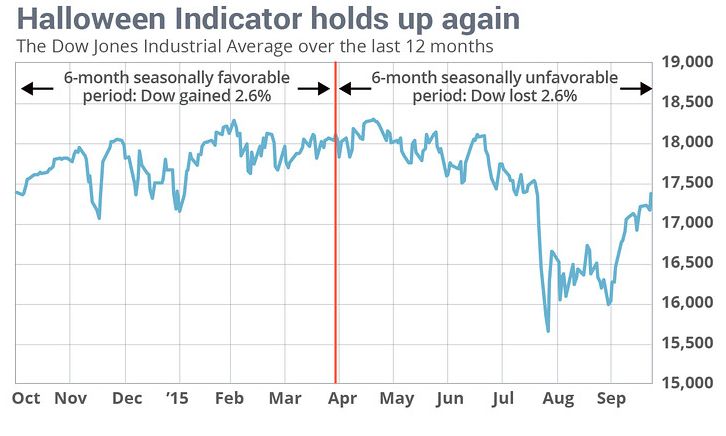
Notice from the chart above that the Indicator worked like a charm over the last year. Over the seasonally-favorable six-month period that began on Halloween 2014, the Dow gained 2.6% — versus a loss of 2.6% in the unfavorable summer months that began last May Day.
What’s particularly noteworthy about this seasonal tendency is that it has persisted despite being widely known. If anything, in fact, it’s been stronger over the last 15 years than it was before. That’s significant, since it was in the late 1990s that academic research into the Halloween Indicator first began circulating widely.
Why this year’s Halloween effect could be even stronger
These already-impressive statistical odds become even better when the stock market is able to buck the seasonal odds and eke out a gain over the September-October period — the last two months of the seasonally unfavorable summer period. That’s exactly what’s happened this year, with the Dow currently 5% higher than where it stood at the end of August.
For example, according to a Hulbert Financial Digest analysis of the Dow back to its creation in the late 1800s, the Dow produced an average Halloween-through-May-Day gain of 4.0% whenever the market was a loser over the two months prior to Halloween.
When it was a gainer, in contrast, the Dow’s subsequent Halloween-through-May-Day gain was 6.8%. This difference of 2.8 percentage points is significant at the 95% confidence level that statisticians often use to determine if a pattern is genuine.
Note carefully that the Halloween Indicator doesn’t guarantee that a bear market won’t occur. But if the future is like the past, the worst of any upcoming bear market will wait until after May Day of 2016 — since the bulk of market damage during past bear markets has occurred during the summer months.
During the 2007-2009 bear market, for example, losses during the summer months were twice as big as those during the winter months. The contrast was even more stark over the 30 months between the bursting of the Internet bubble in March 2000 and the October 2002 bear market bottom: The Dow during the winter months during that decline actually produced a small gain — plus 3.5% — while during the summer months it produced a loss of more than 36%.
 Varchev Traders
 If you think, we can improve that section,
please comment. Your oppinion is imortant for us.

