

- Home
- >
- Market Rumours
- >
- The Bull Train Might Need To Stop And Refuel

The Bull Train Might Need To Stop And Refuel
Rating:

Since the revival of the markets after the election of President Trump, the markets have been very exciting. Every day, we are getting more and more information thrown at us at high speeds: some bullish, some bearish, and some neutral. It is becoming increasingly hard to understand what is going on. Some people shout about a "new normal" while others keep telling themselves "it has to go down, it has to go down".
Instead of doing either, let's look at indicators to guide our macro views. To imagine my views on short-term vs. long-term macro views, I will use the analogy of a futures contract, which I think is very appropriate here. Think of the long-term view as your future price and the current outlook for the short term as the spot price. As we move closer and closer to that long-term date, the ever-changing spot will converge to the future price. Thinking of it like this, you can see why my short-term outlook adjusts week-to-week while I maintain my long-term views.
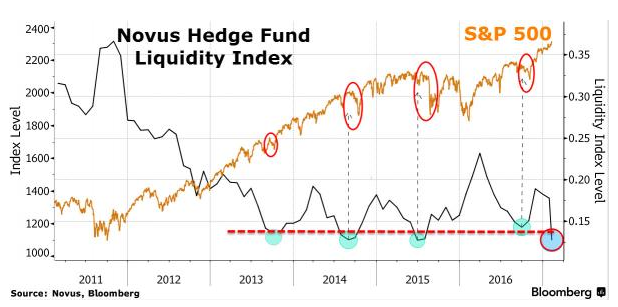
So first off, let us look at the backdrop of our short-term indicators with some recent trends. The first is the recent trends with hedge funds. Presently, we are seeing a large drop in hedge fund liquidity as they crowd into equities. Something important to note is that unlike the average investors, hedge funds typically take on leverage so the fact that we are seeing hedge fund liquidity at such absolute low levels should raise a few eyebrows at the markets' ability to absorb shocks. If there is any lesson that the markets have learned it is that coupling illiquidity and leverage is like dancing a match near a powder keg. Thankfully, neither the levels of illiquidity nor levels of leverage are at nuclear levels. So they point more to a small correction than a massive crisis.

From the graph above, you can see that over the last few years, these periods of low liquidity and equity crowding by hedge funds result in small dips in the S&P 500 (NYSEARCA:SPY) with shocks. This trend has been described by Stan Altshuller, the chief research officer at Novus, as "[a] prisoner's dilemma". For those unfamiliar with the game theory term, a prisoner's dilemma describes the scenario where "the outcome of one person's decision is determined by the simultaneous decisions of the other participants, resulting in a bad outcome for all of them if all act in their own self-interest"

Moving on market indicators, let's take a look at some descriptive statistics on the S&P 500 a few of which are an update from my previous article which you can find here.So far, we have gone 89 days without a 1% drop in the SPY and we have gone 50 days without a 1% swing. All this comes as many securities have reached all-time highs. It has many people wondering what the heck is going on.
Taking a gander at Shiller PE, which is an inflation-adjusted earnings metric, we might see something that might be at least slightly frightening.

Now, let's look at this data with some serious some old school analysis: eyeballing it. As you can see, the current ratios we are observing have only been dwarfed by two periods: Black Tuesday of the stock market crash of 1929 and the height of the tech bubble.
The last indicator is a chart, that compares the S&P 500 movement with the earnings expectations from the companies inside the index.

We are seeing the SPY surge ahead yet the prevailing sentiment of earnings expectations moving downwards; so on a forward PE basis, things appear to be moving in a direction where everything is more expensive to buy (or wonderful to sell).
 Varchev Traders
 Read more:


If you think, we can improve that section,
please comment. Your oppinion is imortant for us.

