

- Home
- >
- Daily Accents
- >
- The Decade of Debt: big deals, bigger risk

The Decade of Debt: big deals, bigger risk
Rating:

With interest rates locked in at rock-bottom levels courtesy of the Federal Reserve’s easy-money policy after the financial crisis, companies found it cheaper than ever to tap the corporate bond market to load up on cash.
Bond issuance by American companies topped $1 trillion in each year of the decade that began on Jan. 1, 2010, and ends on Tuesday at midnight, an unmatched run, according to SIFMA, the securities industry trade group.
In all, corporate bond debt outstanding rocketed more than 50% and will soon top $10 trillion, versus about $6 trillion at the end of the previous decade. The largest U.S. companies - those in the S&P 500 Index .SPX - account for roughly 70% of that, nearly $7 trillion.
Graphic: Long-term debt for S&P 500

What did they do with all that money?
As it happens, American companies did a lot more returning than earning with their cash during the ‘Tens.
In the first year of the decade, companies spent roughly $60 billion more on dividends and buying back their own shares than on new facilities, equipment and technology. By last year that gap had mushroomed to more than $600 billion, and the gap in 2019 could be just as large, especially given the constraint on capital spending from the trade war.
The buy-back boom is credited with helping to fuel a decade-long bull market in U.S. equities.
Graphic: S&P 500 shareholder payouts

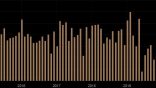
Meanwhile, capital expenditure growth has been choppy at best over 10 years. This is despite a massive fiscal stimulus package by the Trump administration, marked by the reduction in the corporate tax rate to 21% from 35%, that it had predicted would boost business spending.
Graphic: Capital expenditure of S&P 500

One byproduct of stock buy-backs is they make companies look more profitable by Wall Street’s favorite performance metric - earnings per share - than they would otherwise appear to be.
With companies purchasing more and more of their own stock, S&P 500 EPS has roughly doubled in 10 years. Meanwhile net profit has risen by half that, and far more erratically.
Graphic: S&P 500 earnings per share

Graphic: Reported earnings for S&P 500

The corporate bond market has not only gotten bigger, it has gotten riskier.
 Varchev Traders
 Read more:


If you think, we can improve that section,
please comment. Your oppinion is imortant for us.

