

- Home
- >
- Daily Accents
- >
- The five charts of volatility that keep Wall Street awake at night

The five charts of volatility that keep Wall Street awake at night
Rating:

Global markets enjoy rebound, but volatility indicators send new signals to bulls not being too much available. Five indicators that are currently in "eerie lull" are about to give signals for the next "outburst" in the markets.
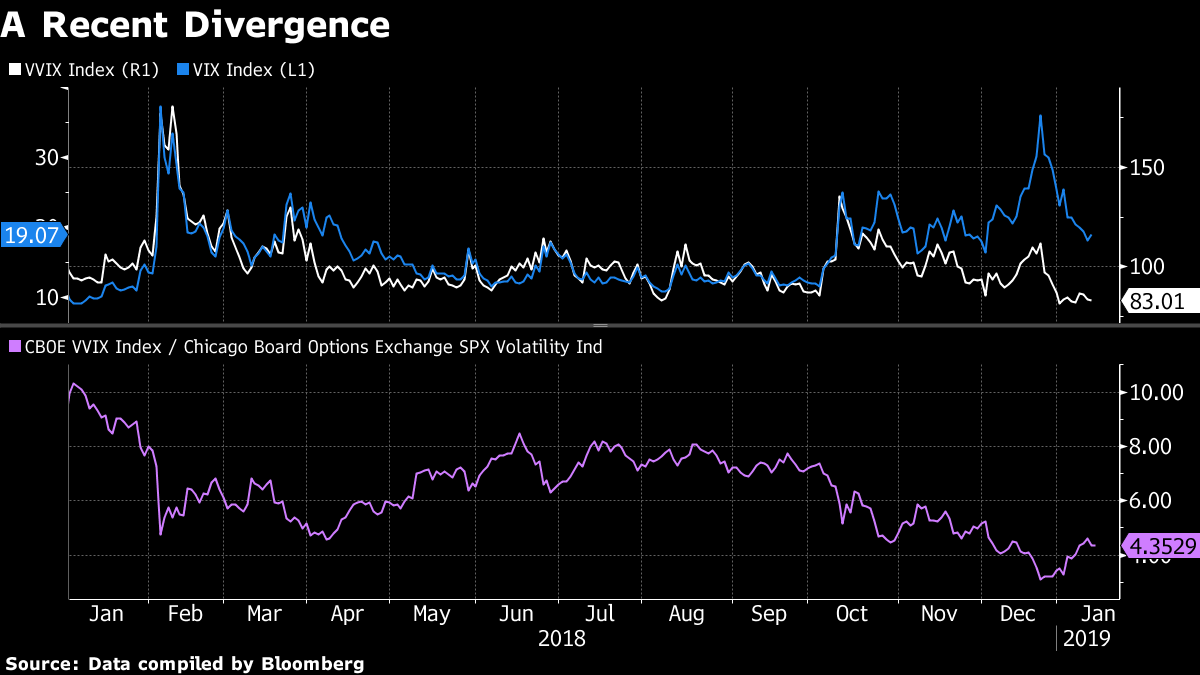
VVIX vs. VIX
At present, investors do not expect renewed moves in too large sizes, which can be compared to the expected extreme movements in the VIX index. This may be a sign of "complacency" in the markets. Mandy Xu, a strategist at Credit Suisse Group AG, said markets would be very vulnerable to volatile volatility this year.

Intraday Volatility
US indices, especially in recent days, have made strong bounce. The 50-day moving average in the daily price changes of the S & P500 is approaching its highest levels since December 2018.

"The weekly S & P500 options and SPY e-mini are becoming more popular and they mainly contribute to the S & P500's intraday volatility." - says Kambiz Kazemi, Portfolio Manager at Financiere Constance in Toronto.
The index has already reached levels that are close to the options and hedging options, and hedging can occur very quickly, which may contribute to the acceleration of overall volatility.
The big curve
Traders can become too optimistic about the price perspectives for indices and stocks. Stuart Kaiser, a strategist at UBS Group AG, says he watches VIX futures - four and six months, which for some time can not be over 20. If the curve goes past 23 it will mean that problems are coming again.

Volatility on bonds
The largest bond market in the world is perhaps too calm. The measured volatility of 10-year US bonds shows one of its lowest values. Bonding volatility is usually a leading indicator of mood swings versus risky assets.

Willingness to hedge
The lowered preemption of defensive hedges is another sign that should be monitored. This indicates either a bullish mood or a set of defense strategies.
Last February there was a jump in demand for hedges. However, this was not the case at the end of the year when the SKEW indicator fell together with shares that began to fall cheaper.

Source: Bloomberg Finance L.P.
Graphs: Used with permission of Bloomberg Finance L.P.
 Trader Martin Nikolov
 Read more:
 Risk off after the escalation in the Middle East, markets are recovering in a period of calm
 The macroeconomic events for today’s trading calendar
 The US government has confirmed the attacks, Trump is calling an emergency staff meeting
 Has the war between Iran and the US started?
 US markets remain under pressure, traders await Iran’s response
If you think, we can improve that section,
please comment. Your oppinion is imortant for us.

