

- Home
- >
- Cryptocurrencies / Algotrading
- >
- The volatility wars

The volatility wars
Rating:

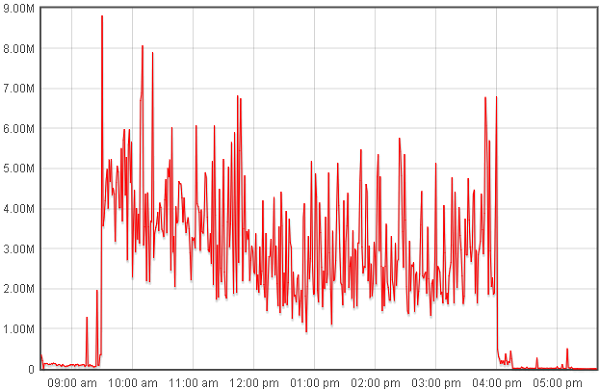
The data collected is the total number of messages that occur simultaneously in any given second across all live data feeds. The graph displays the highest one-second peak that occurs in each minute during the U.S. trading session.
The spikes on the message traffic chart below are from large immediate S&P 500 futures sales ripping through a low liquidity book.
As can be seen from the chart, one hour after start of trading, the volatility sharply rises and makes huge movements. The high volatility time coincides with the announcement of the CPI data for which the S&P 500 was sold off.
By comparing the graphs between 17:30 and 18:30, it can be seen how volatility is reflected in huge range movements in the index.


 Varchev Traders
 Read more:
 Fake news isn’t just a problem for the public, it’s a problem for algos
 Jim Cramer: “It was all about the rise of the machines.”
 RISE OF THE MACHINES or why automated trading could create problems down the line
 JP. Morgan: The next financial crisis will be Flash Crash
 Robo-adviser Scalable Capital hits $1.2 billion
RECCOMEND
WAS THIS POST USEFUL FOR YOU?
If you think, we can improve that section,
please comment. Your oppinion is imortant for us.
If you think, we can improve that section,
please comment. Your oppinion is imortant for us.

