

- Home
- >
- Fundamental Analysis
- >
- There’s no recession coming, at least according to this indicator

There's no recession coming, at least according to this indicator

Rating:

Knowing when the U.S. Economy is heading for recession is paramount for successful investment decisions. Our weekly Business Cycle Index (BCI) would have provided early reliably warnings for the past seven recessions.
The BCI was designed for a timely signal before the begin of a recession, and could be used as a sell signal for ETFs that track the markets like (SPY), (IWV) or (VTI) etc, and switch into treasury bond ETFs like (IEF),(TIP) or (BND) etc. (see our article.)
The BCI uses the below listed economic data, and combining the components for the index in “real time”, i.e. the data is only incorporated into the index at its publication date.
1.10-year treasury yield (daily)
2.3-month treasury bill yield (daily)
3.S&P500 (daily)
4.Continues Claims Seasonally Adjusted (weekly)
5.All Employees: Total Private Industries (monthly)
6.New houses for sale (monthly)
7.New houses sold (monthly)

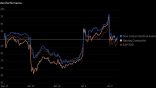
The BCI at 218.7 near last week’s upward revised value, and is marginally below the high for this Business Cycle as indicated by BCIp at 99.8. The 6-month smoothed annualized growth BCIg at 14.2 is above last week’s upward revised 13.8.
The BCI does not signal an imminent recession
Figure 1 plots BCIp, BCI, BCIg and the S&P500 together with the thresholds (red lines) that need to be crossed to be able to call a recession.
The 6-month smoothed annualized growth rate of series is a well-established method to extract an indicator from the series. We use this method to obtain BCIg, i.e. the calculated growth rate with 6.0 added to it, which generates, on past performance, an average 11 week leading recession signal when BCIg falls below zero. Further, the index BCI retreats from its cyclic peak prior to a recession in a well-defined manner allowing the extraction of the alternate indicator BCIp (and its variant BCIw) from which, on average, 20 week leading recession signal is generated when BCIp falls below 25. A more detailed explanation/description can be found here and weekly updates are sent by email to subscribers of iMarketSignals (no paid membership is required). Also, the historic values can be downloaded from iMarketSignals as an MS excel sheet.
Figure 2 plots the history of BCI, BCIg, and the LOG(S&P500) since July 1967, and Figure 3 plots the history of BCIp, i.e 46 years of history which include seven recessions, each which the BCIg and BCIp managed to indicate timely, the weeks lead to a recessions are indicated on the plots.


iMarketSignal
 Varchev Traders
 Read more:


If you think, we can improve that section,
please comment. Your oppinion is imortant for us.

