www.varchev.com

Trade war will not stop the SP500 to end the year with +5% growth

ISM SP500 correlation

Rating:

12345
Loading...

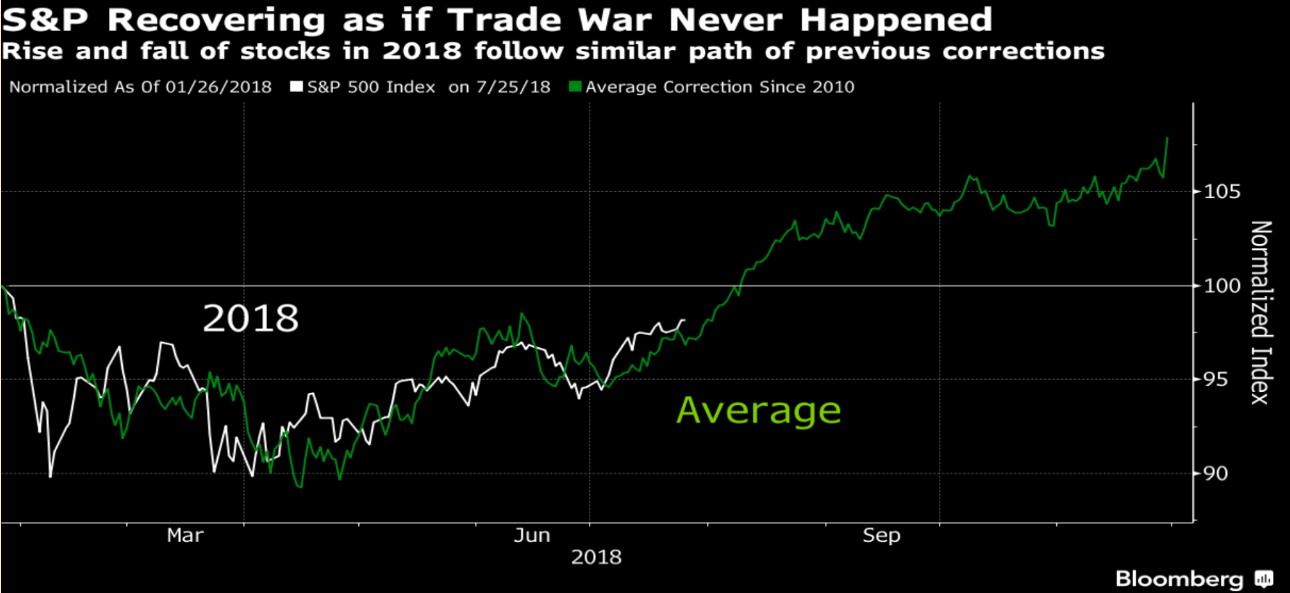
While the headlines on the internet, television and the cult Wall Street newspapers are obsessed with the obsession with the trade war, the SP500 seems live in a parallel universe. If we compare the fall in the index with the last 4 market retracements of about 10%, this year's "crash" is nothing different from the previous ones. This, along with relatively good financial statements, puts the index on its way to a new peak in the early days of August.

Is it reasonable to think that this will happen? Most likely, yes. SP500's annual return reflects changes in the US ISM Production Index. Given that the commercial tariffs have not yet significantly affected economic data, it is quite normal to think that a new peak in August is entirely probable.

On the graph below, we can track the long-term correlation between US Manufacturing ISM and SP500. It seems that even during market crashes the correlation remains stable.

US Manufacturing ISM sp500 corelation

Technically, the price of the index managed to overcome the upper limit of medium-term consolidation, and at the moment it seems that there is nothing to stop it at the previous peak at around $ 2880. Given the pressure on the dollar, as well as the good financial reports, I expect very soon to watch All Time High. On the basic chart, we can also track the projection of the Manufacturing ISM by the end of the year and where is the current price of the index. August forecast data shows that at the end of the month and early September, the SP500 will be close to the previous peak, and the next reporting season will be key to the index.

Source: Bloomberg Pro Terminal

Chart: Used with permission of Bloomberg Finance L.P.


 Trader Petar Milanov

Read more:

RECCOMEND WAS THIS POST USEFUL FOR YOU?
If you think, we can improve that section,
please comment. Your oppinion is imortant for us.
WARNING: Any news, opinions, research, data or other information contained within this website is provided as general market commentary and does not constitute investment or trading advice. Varchev Finance Ltd. expressly disclaims any liability for any lost principal or profits which may arise directly or indirectly from the use of or reliance on such information. Varchev Finance Ltd. may provide information, quotes, references and links to or from other sites and blogs and other sources of economic and market information as an educational service to its clients and prospects and does not endorse the opinions or recommendations of the sites, blogs or other sources of information.
Varchev Finance

London


25 Canada Square, Level 33, office 50, Canary Wharf London, E14 5LQ +44 20 3608 6256

Universal numbers

World Financial Markets - 0700 17 600    Varchev Exchange - 0700 115 44

Varchev Finance Ltd is registered in the FCA (FINANCIAL CONDUCT AUTHORITY) with a passport in the United Kingdom: FCA, United Kingdom - registration number: 494 045, which allows provision of financial services in the United Kingdom.

Varchev Finance Ltd strictly comply with the statutes of the European directive MiFID (Markets in Financial Instruments). targeting increased efficiency, transparency and uniformity of financial instruments.
Varchev Finance Ltd is authorized and regulated by the Financial Supervision Commission - Sofia, Bulgaria: License number RG-03-02-05 / 15.03.2006

The information on this site is not intended for distribution or use by any person in any country or jurisdiction where such distribution or use would be contrary to local law or regulation.


Disclaimer:

CFDs are complex instruments and come with a high risk of losing money rapidly due to leverage. 63,41% of retail investor accounts lose money when trading CFDs with this provider. You should consider whether you understand how CFDs work, and whether you can afford to take the high risk of losing your money.

chat with dealer
chat with dealer
Cookies policy