

- Home
- >
- Trading University
- >
- Trading the Bearish Harami Candlestick Pattern

Trading the Bearish Harami Candlestick Pattern
Rating:

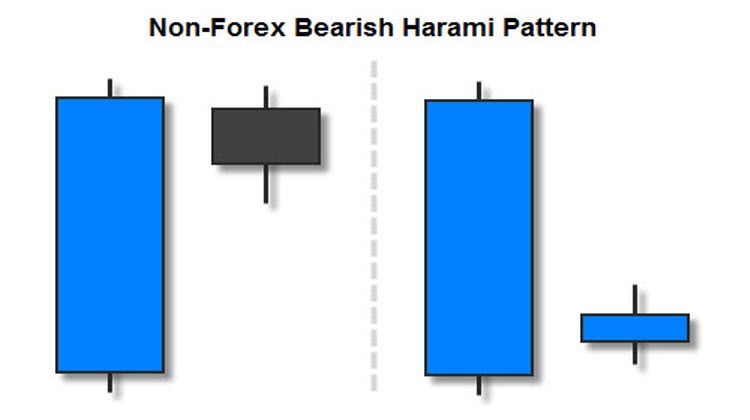
Trading the Bearish Harami Candlestick Pattern
In the image below, you can see a bearish harami candlestick pattern followed by a short dip in price. I chose this particular instance of the pattern for 2 reasons:
- This pattern shows that, although price action signals (when used correctly) have a high probability of indicating the immediate direction of the next price movement, there is never any guarantee on how long this movement with last. You must be prepared to take profits early in some cases. This is true for all price action patterns.
- Although the bearish price movement was short-lived, in this case, you could have still made a nice profit on this trade due to the high risk to reward ratios that the harami patterns typically offer. This is because your entry point would have been 1 pip below the bottom wick of the smaller, second candle of the pattern.

Even though the dip in price in the example above was short-lived, you still could have made, at least, twice what you would have risked on that trade. Imagine the kind of risk to reward scenarios you could achieve when the bearish harami pattern is followed by a full reversal with some conviction. It’s not uncommon to achieve 5 times your risk when these trades work out nicely.
The downside to this candlestick pattern is that it is only a moderately strong reversal signal. As I mentioned earlier, it is not to be treated in the same respect as a strong reversal signal, such as a hammer, morning star, engulfing pattern, etc. In fact, some traders, including Steve Nison, trade this pattern as they would trade a doji.
Don’t give up on the harami patterns just yet, though. The favorable risk to reward scenarios can make up for many losses. Even small corrections in price (like in the example above) can make up for 2 or more losses. Of course combining these harami signals, or any price action pattern, with a good trading system will help to qualify the best trades to take. At the very least, you can use these signals as an indicator of when to take profits on trades that you are already in.
Example: You are in a bullish trade, riding the price action steeply upward (as in the example above). Next, you see the bearish harami develop. As this is a bearish indicator, you would use this signal as a place to either close or partially close your trade.

I included the example above because the context in which you take any price action signal is the first and most important thing to consider. Earlier, I mentioned that a true bearish harami candlestick pattern only occurs after an uptrend in price. The example above shows an uptrend with a small retracement in price that occurs before our candlestick signal.
This small retracement may have led a less experienced trader to disqualify the harami pattern that occurred afterward. However, this is still an example of an uptrend until after our pattern. I wouldn’t consider any downward movement during an uptrend to be more than a retracement, unless it consists of 3 or 4 strong bearish candlesticks (or perhaps 2 very large candlesticks) or a series of lower highs and lower lows (which occurred after our pattern).

The bearish harami pattern pictured above is an example of this particular candlestick signal that would have worked out very well. You could have made twice what you were risking on this trade before the first candlestick closed. Obviously, the trend continued downward from there.
The trigger to jump into a properly qualified bearish harami is when price breaks (1 pip) below the low of the smaller, second candlestick in the pattern (see the image above). You would place your stop loss (1 pip) above the highest high in the series of candlesticks that formed your harami pattern (see the image above).
Note: If another candlestick pattern or other relevant resistance level is slightly above your candlestick pattern, always place your stop loss (1 pip) above the higher resistance level. In the example above, the first candlestick in the pattern made the highest high, and there were no other relevant resistance levels nearby, so this rule did not come into play.
Another thing to note is the size of the first candlestick of the pattern in relation to the other nearby candlesticks. In the example above, the first candlestick is much larger than the previous 12 candlesticks pictured. Psychologically, this gives more relevance to the pattern. It signifies that, even after a confident rally by the bulls, the overal market is not quit sure that upward price movement is the right direction at this time.
Final Thoughts
All candlestick patterns are great short term signals, but there is never a guarantee that the new direction of price will follow through with any conviction. Sometimes candlestick patterns signal small retracements in price. The harami patterns excel in these situations, because of the favorable risk to reward scenarios that they typically present.
Remember that a true bearish harami only occurs after an uptrend in price. The stronger the uptrend, the more relevant the signal in most cases. Never trade any candlestick patterns during periods of price consolidations (sideways markets).
Choosing only the best entries and using wise money management skills will go a long way to preserve your capital and ensure your continued success while trading these candlestick signals. As always, be sure to demo trade these signals until you are consistently profitable before risking your hard earned money.
 Varchev Traders
 If you think, we can improve that section,
please comment. Your oppinion is imortant for us.

