

- Home
- >
- Trading University
- >
- How to Make Money at the opening of the Markets

How to Make Money at the opening of the Markets
Rating:

The open of any trading day sets the tone for the rest of the trading day. Here’s how you can tak advantage of volatility at the open and generate profits from it.
The open is the most important time of the day for a trader. It is when both institutional and large traders alike show their hand. The open sets the tone for the rest of the day and if you can understand the open, profits will come much easier. For novice traders, the added volatility at the open can be slightly intimidating, but in this article, I intend to show you that the added volatility can create more opportunity. You no longer have to wait an hour or more for the market to set up. If the opportunity presents itself, you can start trading well before the market sets up. I have also included three detailed setups that I use when trading the open. When I trade, I do not use many indicators. I believe price is the ultimate indicator and all indicators need price to populate. That being said, I do use indicators for different types of volume analysis, which is what I’ll discuss in this article.
Volume analysis
The volume profile is an invaluable tool that helps me find absorption and at many times helps to identify the intent of institutional traders. An example of absorption would be if price is trending lower intraday and buyers step in and “absorb” all the selling, and then push the price higher. This is not something that can be easily comprehended just by looking at traditional charts like candlestick charts. At first glance, a volume profile chart may look a bit peculiar, but in time, your perception of it will change accordingly. Typically, volume is plotted horizontally across the bottom of your chart. It reveals the same volume but with much more detail. In Figure 1 you can see that it is displaying volume at every price. It is plotted vertically instead of horizontally, and to the right of the volume profile you can see what price the volume is trading at.

Not all prices are equal, however, and the volume profile helps to better visualize important prices. You’ll be able to see where a large percentage of the day’s volume traded. In the chart in Figure 1, the blue area, or value area, is where 70% of the volume traded. The gray area is where around 30% of the volume traded and the red bar is the volume point of control or VPOC. This bar reflects the price where the most volume has been traded for the day. Different software will display these levels slightly differently but you’ll still be able to clearly see these three areas. You can use this information in different ways but here, I focus only on how to use it for trading the open. Before moving on to the setups, I will briefly touch on the subject of context. It’s easy to tell you to just stick to your strategy no matter what, and while that is good for developing discipline, it can be counterproductive. That is because
it does not take context into consideration. Nine times out of 10, I buy when I see a buy signal, but the 10th time it may be in an extremely bearish context and I would be better suited to pass on that trade. Or better yet, it is possible to anticipate the rookie traders getting run over and go against them. How and when do you execute your trades using volume profile charts? Sometimes it’s best to sit on the sidelines and wait for the market to set up and other times it’s beneficial to act early.
The opening bell
Here’s how you find opportunity at the open. The first clue is where the market opens in relation to the previous day. Does it open in the middle of yesterday’s range? Does it gap higher or lower? Does it open inside the upper or lower range of the previous day? Where it opens is important. If there’s a gap at the open, it will likely provide extra volatility because some traders will be underwater (in a losing position) and be forced to liquidate. Volatility equals more opportunity so it is essential you look for that. If the open is in the middle of the previous day’s range, it suggests that not much has changed and there is less opportunity. You may have to wait for the market to set up before trading.
Convict ion at the open
The next thing you need to do is gauge the conviction at the open. You should ask yourself
these questions: Is there a high-conviction open or a low-conviction open? What does a high- or low-conviction open look like? A high-conviction open moves in one direction and does not trade back through the opening price. Price may move one or two ticks back through the opening price but not much more. A high-conviction open is not enough to trade in isolation. You still must do a thorough analysis to mdetermine who has control as well as take a contextual view of the market.
Execution
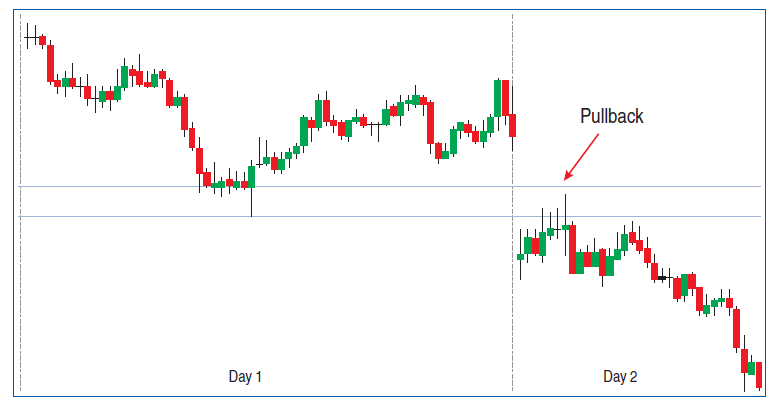
Now that you have an understanding of the difference between high and low conviction and high and low opportunity, you can move on to setups. The optimal time to be trading is when the opportunity is high, the conviction is high, or both. However, there are instances where conviction and opportunity are low but then seemingly out of nowhere, aggressive buyers/sellers enter the market. As traders, you should be prepared for anything and be able to act quickly and aptly. Usually, when there is a price gap, traders tend to enter on a pullback. A pullback to the previous day’s high/low is a good place to enter.
In Figure 2 price gapped lower and pulled back to the previous day’s low and sold off. This would be a
good spot to go short. What’s interesting about this day is there was a low-conviction open because price moved back and forth through the opening price.

The example I provide next is one way that you can trade when the previous day’s high or low is not tested. In Figure 3 you see a high-opportunity, high-conviction open that did not pull back to the previous day’s low.

You can see that price failed at the open and immediately pushed lower. When this happens, it is clear the conviction is to the downsideb and you should look to go short. A great opportunity is if
price retests the opening price, but this must be in the form of a pullback. If the opening bar is bearish and then the next bar reverses and tests the open, you would pass because that could be absorption. In this example, sellers have high conviction and they will most likely defend the open. Traders who missed out on the short will also look to enter on the pullback.
Advanced volume analysis
When using volume profile for trading the open, I look for unusually high volume at a single or few price points. It is important to not just blindly follow a trading system, taking every trade under all market conditions. Rather, you need to assess each situation under current market conditions and then act accordingly. The next example shows how to be aware of who has control. You see a high-conviction open with sellers dominating only to be met by stronger buyers. You may not be able to see this
without the volume profile. If you just look at a bar chart, you may end up looking for a short when price pulls back to the open. It is difficult to step in front of a falling or rising market and fade it or go against the market. Figure 4 shows a high-conviction open with sellers showing strength. If you weren’t looking at the volume profile chart, your initial instinct would be to go short when price pulls back to the open. There is a developing volume profile to the left and the corresponding candlestick chart to the right.

The VPOC (red bar) on the volume profile indicates that as price traded lower, there was greater volume near the low. This would be normal if price kept moving lower. The interesting thing is that price traded higher and when price revisited the VPOC, price moved higher once again. This is what I mean by “absorption” and indicates that as price moved lower, large buyers were stepping in and absorbing the price. The volume profile is a handy tool for detecting these types of price action. Without seeing the price action on the volume profile, you may have looked to go short.
And in the end: There is no holy grail in trading. There is no setup that will work in all market conditions, which is one reason trading is so difficult. The good news is that once you have a deep understanding of what is happening, you can plan your trading strategies. You can adapt to changing market conditions and have an edge over the competition.
Source: Stocks and Commodities
 Varchev Traders
 Read more:
 The Amateur VS The Professional; The Difference is in The Mind
 A story of a trader: ‘Trading can take over your life – but only if you let it’
 How to Filter Good & Bad Price Action Entry Signals
 The smartest way to invest your first $1000
 Should S&P500 be afraid from Friday 13th what the statistics look like
If you think, we can improve that section,
please comment. Your oppinion is imortant for us.

