

- Home
- >
- Daily Accents
- >
- Two Indicators to Watch as U.K. Stocks Flirt With Record High

Two Indicators to Watch as U.K. Stocks Flirt With Record High
Rating:

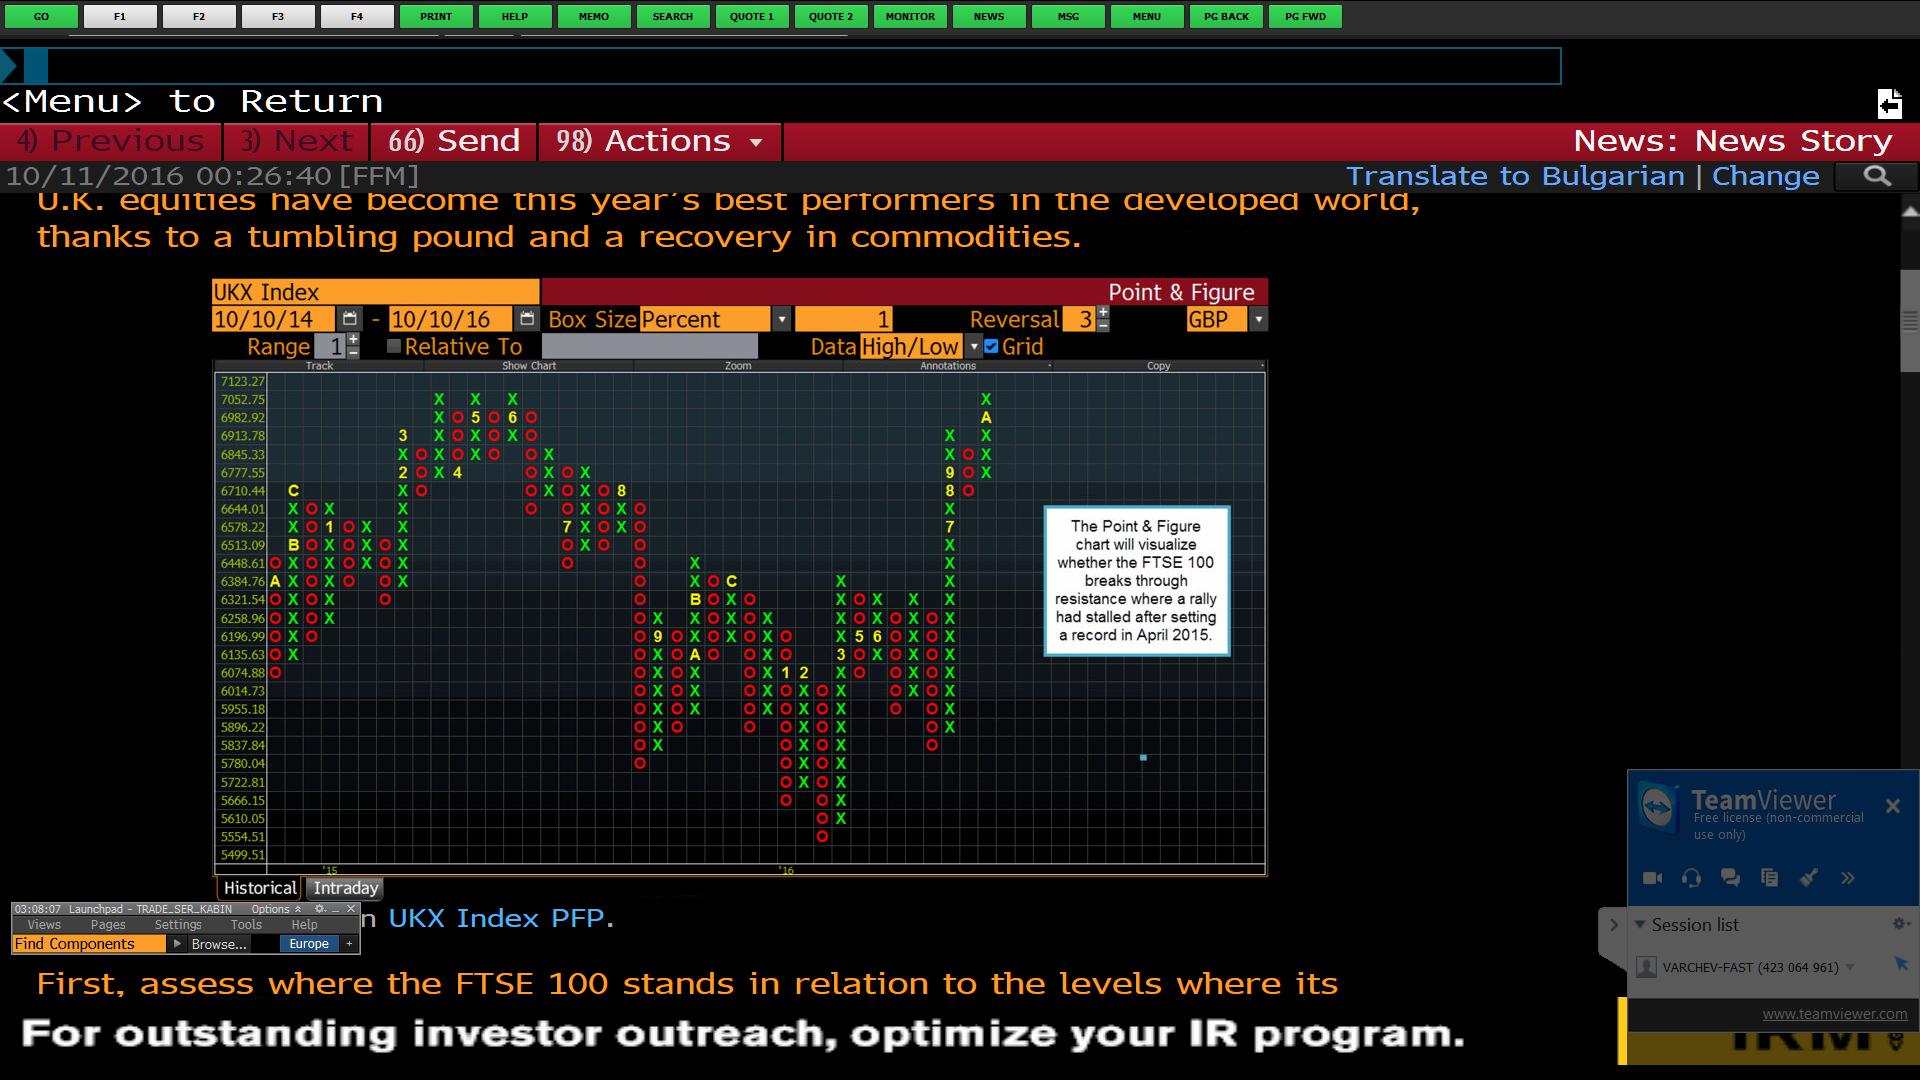
U.K. equities have become this year’s best performers in the developed world, thanks to a tumbling pound and a recovery in commodities.
First, assess where the FTSE 100 stands in relation to the levels where its previous record move stalled in 2015.

Point & Figure charts help to identify price trends in markets. The columns of red O’s show a falling market, while green X’s show advances. The yellow letters and numbers represent months. January-September are represented by 1-9 and October-December by A, B and C.
Now, set the parameters of the chart:
• In the amber box next to Box Size, use the dropdown to select Percent.
• In the amber box to the right of Percent, type "1". This means that each box in the chart represents a 1 percentage point move in the FTSE 100.
• Make sure the amber box next to Reversal is set to "3". This means the index has to rise or fall 3 percent for a new direction in the chart to be initiated.
• The Data field should display High/Low. The tab at the bottom left of the chart should be set to Historical.
The chart shows that the FTSE 100 is in a column of X’s, representing rising prices. Notice that the current X is at 7,052.75, which served as significant resistance for the index from March to June of 2015. (The FTSE 100 last set a record in April 2015.) Subsequently, the market dropped more than 20 percent before marking a bottom.
To break through this significant level, the index would need to print another X by rallying at least 1 percent (on an intraday basis) from 7,052.75, which is 7,123.27. Point & Figure charts can help visualize such movements in an easy-to-comprehend way.
Set the start date to 10/10/2014 and hit . In the Profit (Loss) group of columns, click on the header for %Total to rank the P&L of the strategies in descending order.
The Williams %R strategy, a mean-reversion strategy, is the top performer, having generated a return of about 70 percent over the two years. That compares with a 20 percent gain by the FTSE 100 in the same period
Click into the Williams %R line in the table. The top chart on the screen shows the buy and sell trigger points in the strategy. The bottom chart shows when it has crossed overbought and oversold levels. The center chart shows that the strategy has gained consistently over the two-year period. Generally, the longer a strategy has been working, the longer it’s likely to keep working.
The statistical table on the right of the screen provides other data on the strategy. The %Winning Ratio at the lower right is 77.5 percent. The Sharpe Ratio is 2.36.

The Williams %R may provide signals for when to buy or sell the FTSE 100, and it’s possible to set up alerts for when it reaches a new trigger point.
To do so, go to the red toolbar at the top of the screen and click Actions and then Save As. In the pop-up box, give the backtest a title, such as "Williams %R", and hit Update. This saves the strategy into a user’s personal library in the Backtesting & Optimization function, BT.
Go to BT, and click the bell icon to the right of the saved entry for Williams %R. In the pop-up, make sure that the Source dropdown is set as Single Security and that Security is set at UKX Index. Then hit the gray Next button and then Create. You’ll now get an alert every time the Williams %R sends a buy or sell signal on the FTSE 100.
Read more:
 And for all the bounty hunters: Iran offers $80m for the head of Donald Trump
 US service member and 2 US Defense Dept contractors killed in Kenya attack
 Iranian Quds leader Qasem Soleimani has been killed – how are markets reacting
 A calm end of an otherwise loud 2019
 Old but Gold – Top 5 posts of Varchev Finance
If you think, we can improve that section,
please comment. Your oppinion is imortant for us.

