

- Home
- >
- Stocks Daily Forecasts
- >
- Two undervalued stocks which is better to buy during the US session

Two undervalued stocks which is better to buy during the US session
Rating:

American airlines
This share is the US airline American Airlines with ticker AAL.
Fundamental:
The company has very good financial indicators which in past years marked double-digit growth. Net profit grows an average of $ 12 billions over the past four years.
Given the strong development of the sector and the fact that flights worldwide every two years, doubled the purchase of shares of aviation company is a good investment for the future. Currently the stock is undervalued by about 30% and is recommending investors to buy, which makes it quite attractive.
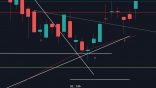
Technical analysis:
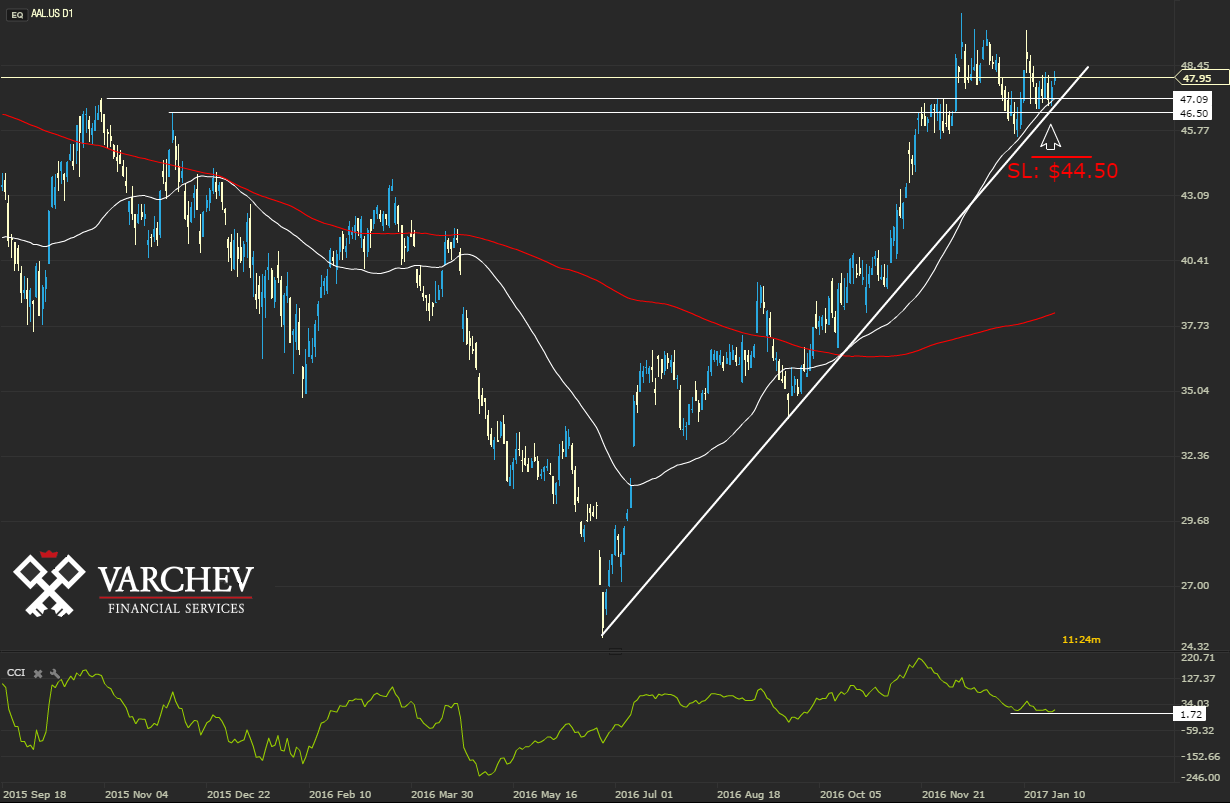
The price is in a strong uptrend and is highly penetrated horizontal resistance level, which is supported by diagonal support and 50 period simple moving average.
indicators:
50SMA above 200SMA - a positive signal for the price
CCI (50) - e above 0 - positive signal
Price Action: Bull Two Reversal formation - a positive for the share price.
SL: $ 44.50
Graphics:

Alternative scenario: If the price crosses back below the diagonal and keep there, the positive scenario there will most likely be corrupted and will be more likely to see a decline.
Bank of New York BK
Bank of New York BK.US
This is a bank that share is undervalued by more than 38 percent and technical and fundamental levels gives us good input on trend upward.
Fundamental data: actual stock price is currently $ 44.94 or a $ 17.41 less than its fair value. Since the beginning of 2017, the banking sector is growing and it's good to share. In 2017 it is expected to raise key interest rates in the US and this would affect well the banking sector which is located this company.
The company has strong financial results over the last three years, net profit and revenues and grow through each quarter.
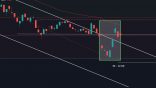
Technical analysis:
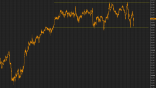
The price is in a clear uptrend as the price corrected to levels of horizontal support.
indicators:
50SMA above 200SMA - positive price
CCI (50) - rotated from 0 up and remained in positive territory, which the indicator means that the current trend is still valid - a positive signal for the price.
Price Action: devouring bull bar support levels - a positive signal for the price.
SL: $ 41.00
Graphics:

Alternative scenarios: if the price back below horizontal and diagonal support positive scenarios will be spoiled and is likely to see a decline in the share price.
Trainee_P_Milanov
 Varchev Traders
 Read more:
If you think, we can improve that section,
please comment. Your oppinion is imortant for us.

