

- Home
- >
- Stocks Daily Forecasts
- >
- US30, short is still more attractive after break of key level

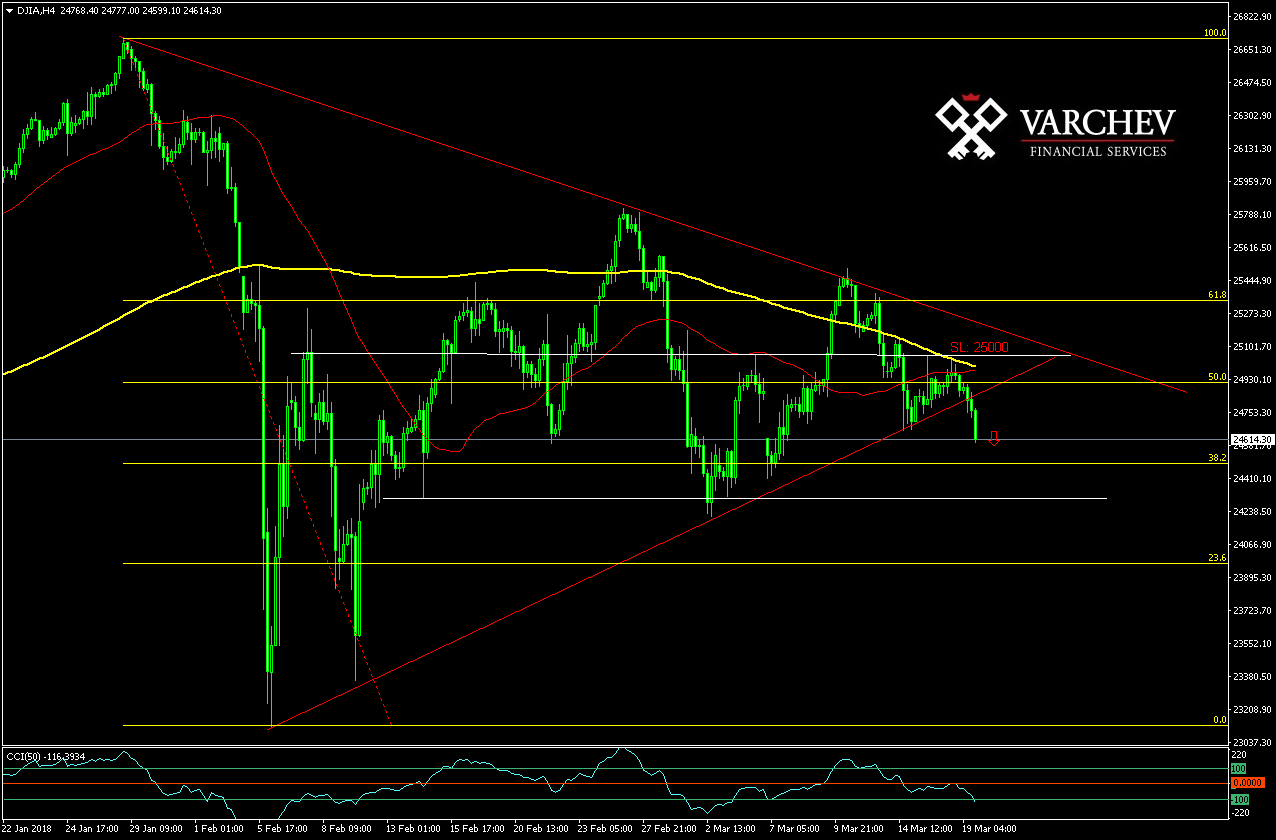
US30, short is still more attractive after break of key level
Rating:

Index forecast / US30 / Our expectations
Middle-term downward trend, the price is making lower tops. Formed figure Triangle and break below the diagonal support of the figure. The price remains below the zone of support where FiBo 50.0 and diagonal support are crossing. Technical indicator: CCI(50) - breaking below level -100 - the negative sentiment strengthens. The price remain below SMA 200/50 - negative signal.
Alternative scenario: If the price pulls back in the triangle, the execution of the figure will failed and the negative scenario will be dismissed.
SL: 25000
Trader Bozhidar Arabadzhiev
 Varchev Traders
 Read more:
 US – Iran – Iraq tension remain the main driver of the stock market today
 How top market players on Wall St think 2020 will look like on financial markets
 Money Flow before the start of the new trading week
 Cincinnati Financial Corporation (CINF.US) -Opportunity for long positions
 Asia stocks gain as Fed signals no rate cuts in 2020
RECCOMEND
WAS THIS POST USEFUL FOR YOU?
If you think, we can improve that section,
please comment. Your oppinion is imortant for us.
If you think, we can improve that section,
please comment. Your oppinion is imortant for us.

