

- Home
- >
- FX Daily Forecasts
- >
- USD / CAD: Break of the diagonal support, possible decrease after a correction

USD / CAD: Break of the diagonal support, possible decrease after a correction
Rating:

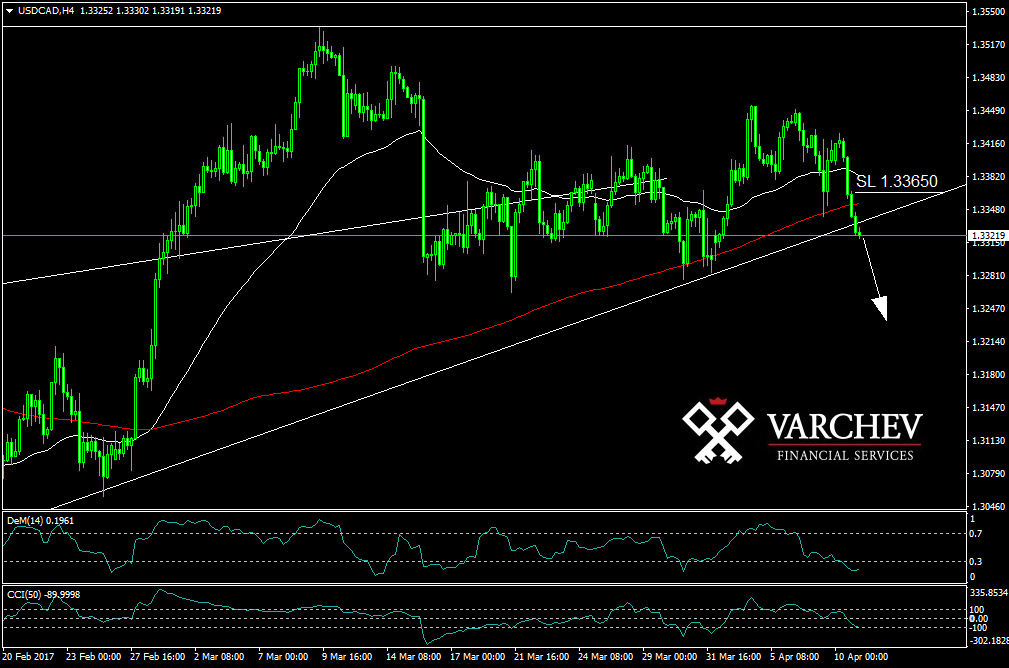
USD / CAD: 4H chart - break of the diagonal support
Price below the diagonal resistance
Indicators:
50/200 MA: 50 above 200, price below 200 - a negative signal
DeM is rotating in overbought zone, we might see a correction to the level of resistance
CCI (50) will give a signal for short position if it goes under-100
SL: 1.33650
Sentiment: Increasing price of oil past the tension in Syria have good effect on the canadian
Alternative scenario: if the price goes back above the resistance we might see a false breakout and a new rise in the price of the dollar.
Trader_I_Ivanov
 Varchev Traders
 Read more:


RECCOMEND
WAS THIS POST USEFUL FOR YOU?
If you think, we can improve that section,
please comment. Your oppinion is imortant for us.
If you think, we can improve that section,
please comment. Your oppinion is imortant for us.

