

- Home
- >
- Opportunities for profit today
- >
- USD / CAD: The Formation Remains Negative

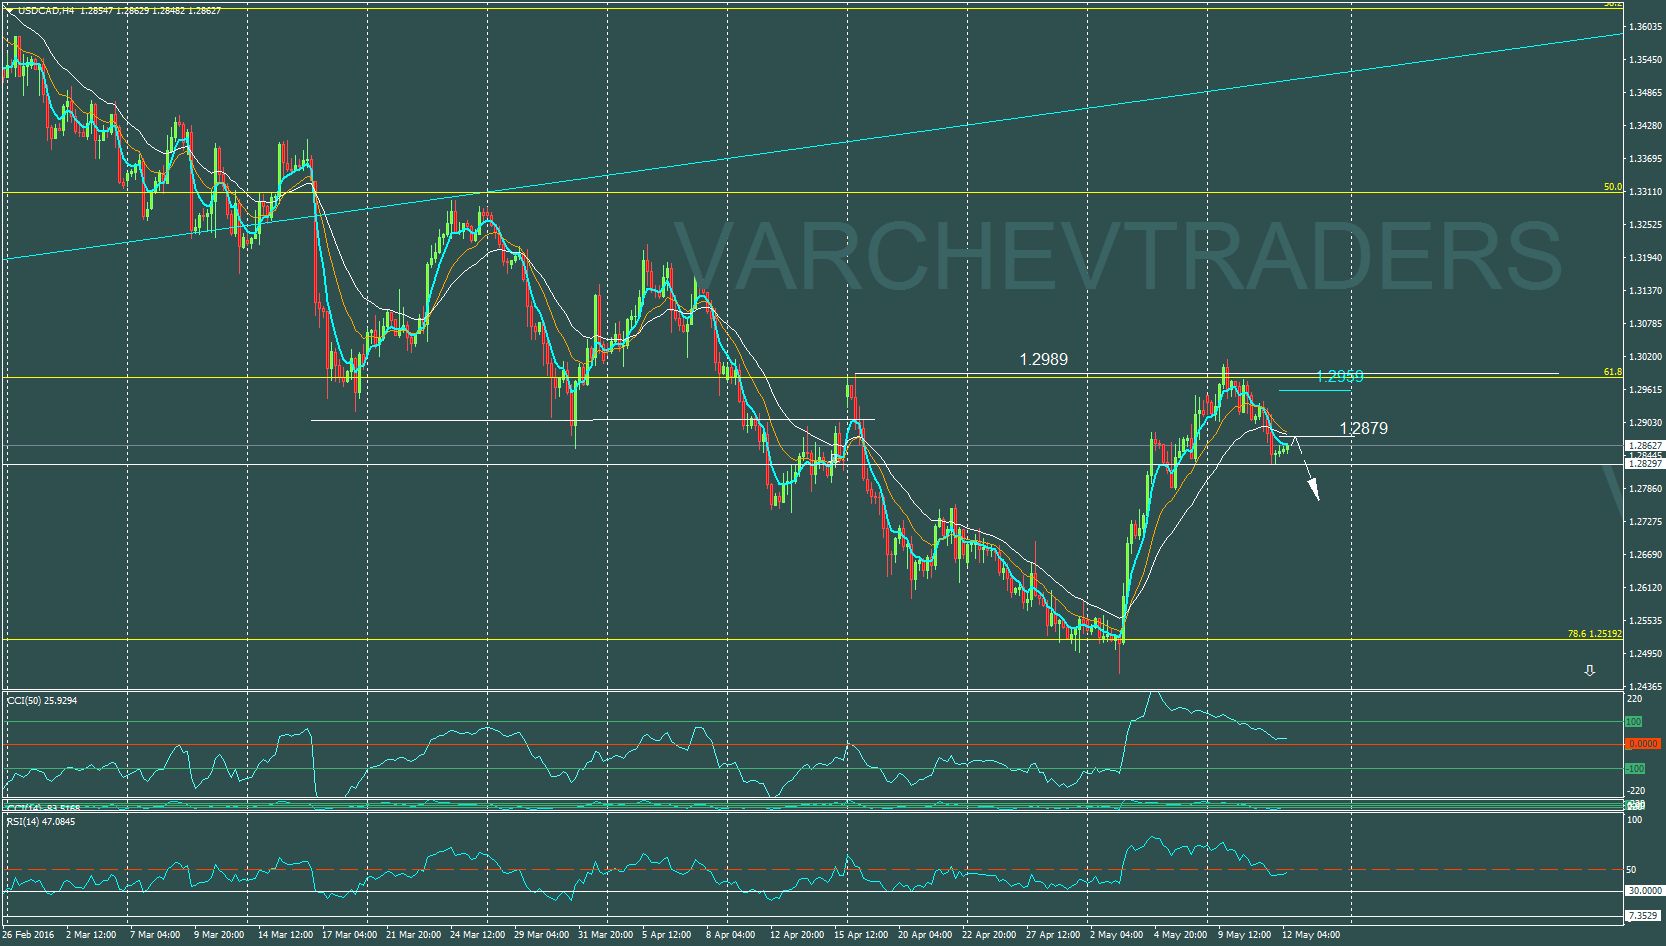
USD / CAD: The Formation Remains Negative
Rating:

USD / CAD: 4H chart, Bearish Trend, short-term correction;
Fibonacci retracement till resistance levels at 23.6%;
Double top - a bearish flag on a downward trend at 1.2989 price levels;
Price action: devouring bar, followed from several trend confirming formations;
4 small corrective bars are within the bearish bar, that confirms the possible short;
Moving Averages are in Bearish formation, 5 EMA is under 13 and 25. Test at 25 EMA will give us a signal of possible Short; after correction RSI is below 50 - Negative Signal;
SL: 1.2959
Alternative scenario:
Negative trend will be broken if the price passes above the previous peak.
Stephen D. Angelov - Head of Stocks Trading
 Varchev Traders
RECCOMEND
WAS THIS POST USEFUL FOR YOU?
If you think, we can improve that section,
please comment. Your oppinion is imortant for us.
If you think, we can improve that section,
please comment. Your oppinion is imortant for us.

