

- Home
- >
- FX Daily Forecasts
- >
- USD / CHF: Good levels for short positions

USD / CHF: Good levels for short positions
Rating:

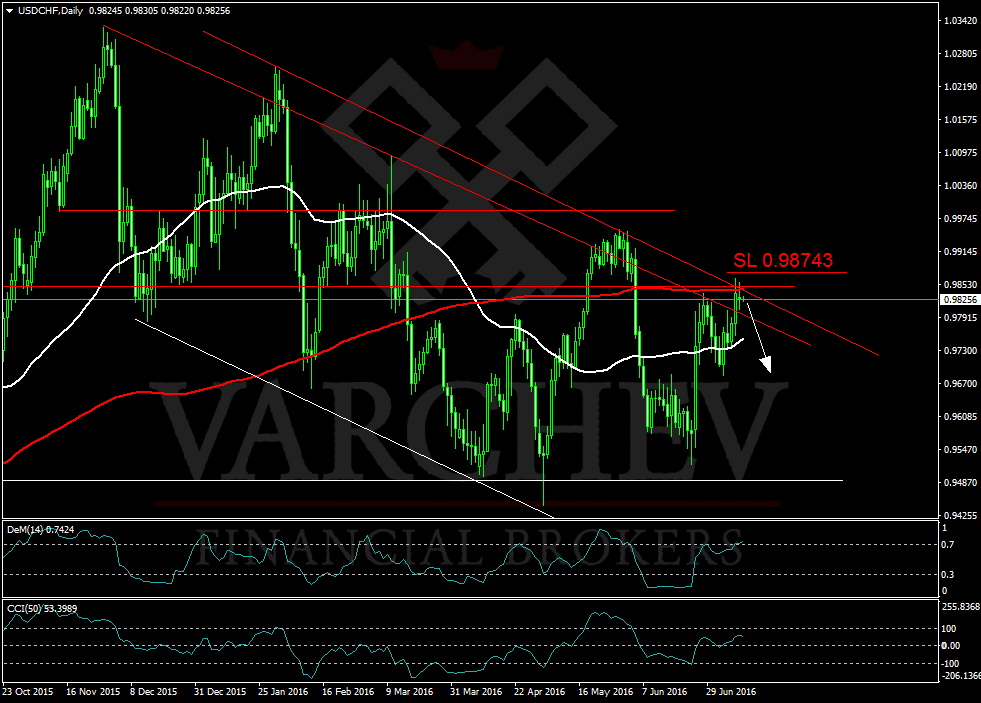
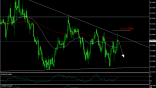
USD / CHF: Daily chart - downtrend
Price levels of horizontal, diagonal resistances and 200 MA
Price aciton: indoor bar and formation "top-spin" a false breakout of resistance and 200MA - possible reversal of the price
indicators:
50/200 MA: price below 200, 50 under 200MA - a negative signal
DeM (14): In the area of over-bought market - possibly turning the price downwards
SL: 0.98743
Alternative scenario: If the price crosses above the resistance it is possible to break the negative trend id rather see appreciation of the couple.
Jr_Trader_I_Ivanov
 Varchev Traders
 Read more:

RECCOMEND
WAS THIS POST USEFUL FOR YOU?
If you think, we can improve that section,
please comment. Your oppinion is imortant for us.
If you think, we can improve that section,
please comment. Your oppinion is imortant for us.

