

- Home
- >
- FX Daily Forecasts
- >
- USD/JPY: as long as price is below 111,415 shorts is more likely

USD/JPY: as long as price is below 111,415 shorts is more likely
Rating:

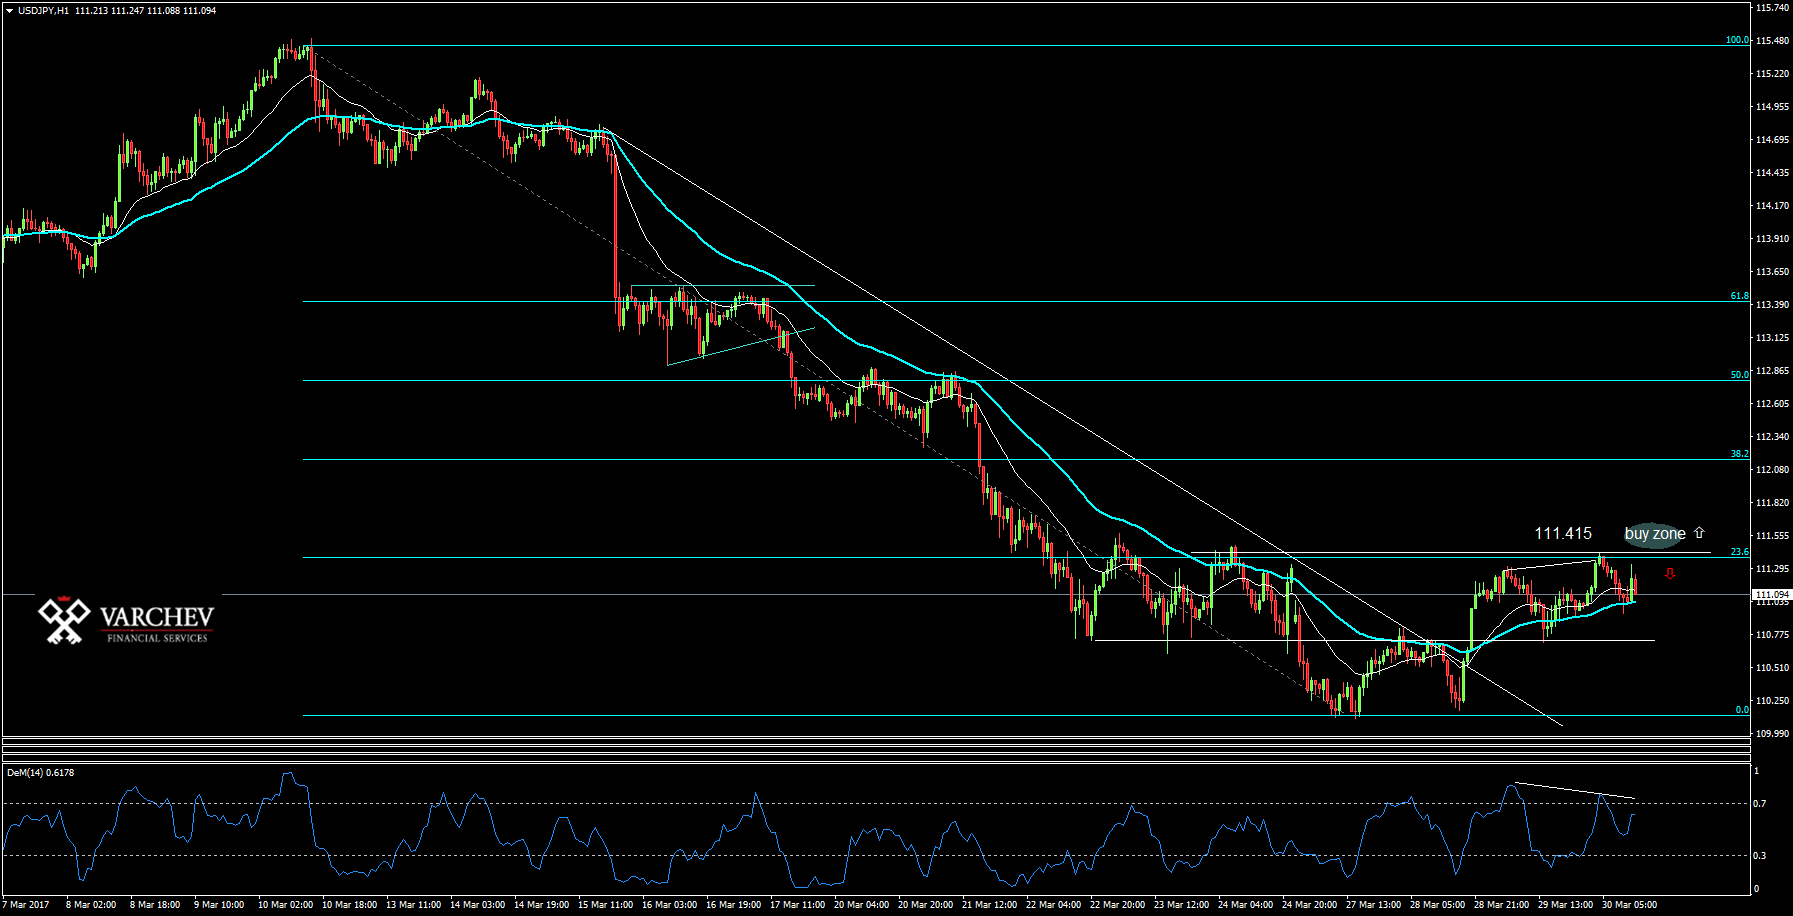
USD/JPY: Mid-term movement short
Correction to levels of Fibonacci 23.6%
Correction to levels of horizontal resistance 111.415, with no break, which means that the movement remains short.
Only break above 111,415 will give a signal to buy, because it is NECK line of the figure - Head and Shoulders
The indicators also show a greater likelihood of a fall: divergence in DeM
On the other hand we see a strong signal to reverse the medium-term trend, but the amplitude of the double bottom is small, which does not give us more likely to buy.
Therefore, until we dont have break above 111.415 shorts is likely.
Stephen D. Angelova - Head of Stocks Trading
 Varchev Traders
 Read more:


RECCOMEND
WAS THIS POST USEFUL FOR YOU?
If you think, we can improve that section,
please comment. Your oppinion is imortant for us.
If you think, we can improve that section,
please comment. Your oppinion is imortant for us.

