

- Home
- >
- Fundamental Analysis
- >
- USD/ZAR: the risk of Zimbabwefication

USD/ZAR: the risk of Zimbabwefication
Rating:

Zimbabwe is a country in Southern Africa, most famous with achieving the highest inflation rate and most dramatic devaluation in history. One billion Zimbabwean dollar banknotes serve as warnings to any emerging market economy. The reasons for this crisis are complex but the main culprits are corruption (graft), lack of control of public finances and the monetary base (M0 and M1), and the forced confiscation of land from white farmers for redistribution. After the end of Apartheid (apartness) in South Africa, the divisions in society remain stark: although equal by the law, whites own 86% of land in RSA and 70% in Zimbabwe (where whites are 0,7% of the population). Robert Mugabe, Zimbabwe's former president, solved this problem in a simple way: take the land from the whites and redistribute it. The effects are destructive. Maize crop yields, the main source of nutrition in the country, fell by 31% between 2002 and 2012. Tobacco yields fell by 66% between 2000 and 2005.
Fundamental picture: South Africa and ZAR
This historical background explains the anxiety of investors and businessmen regarding the proposed reform the RSA's constitution to allow the government to confiscate land without compensating owners with market prices. The reform faces internal support: the ANC, the ruling party, holds 62% of parliament (66% are needed for the reform to pass).
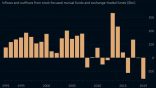
Outside pressure against the reform, however, is mounting. President Trump drew attention to the reform, which puts the reform's future in question. If Trump wanted to, as we have seen this year, he can easily impose sanctions or tariffs without hesitation. The U.S. directly accounts for 7,2% of RSA's exports. Indirectly, by going "the Iran route", it could isolate a further 33% of RSA's export markets (Canada and the EU). This, of course, is a drastic scenario. Here is a breakdown of RSA's export markets:

The pain for South Africa could come from the overall economy as well. This is a breakdown of RSA's exports:

South Africa's exports are mainly raw materials: precious metals like gold and platinum or industrial metals like steel, aluminum and copper. All of them have been in a strong downtrend. Copper this week fell below $6,000 on the LME. Platinum is currently trading at the lows it previously reached during the 2008 crisis.
All of these factors support the fall in ZAR over the past few months. These supportive fundamentals are also visible in the technical picture.
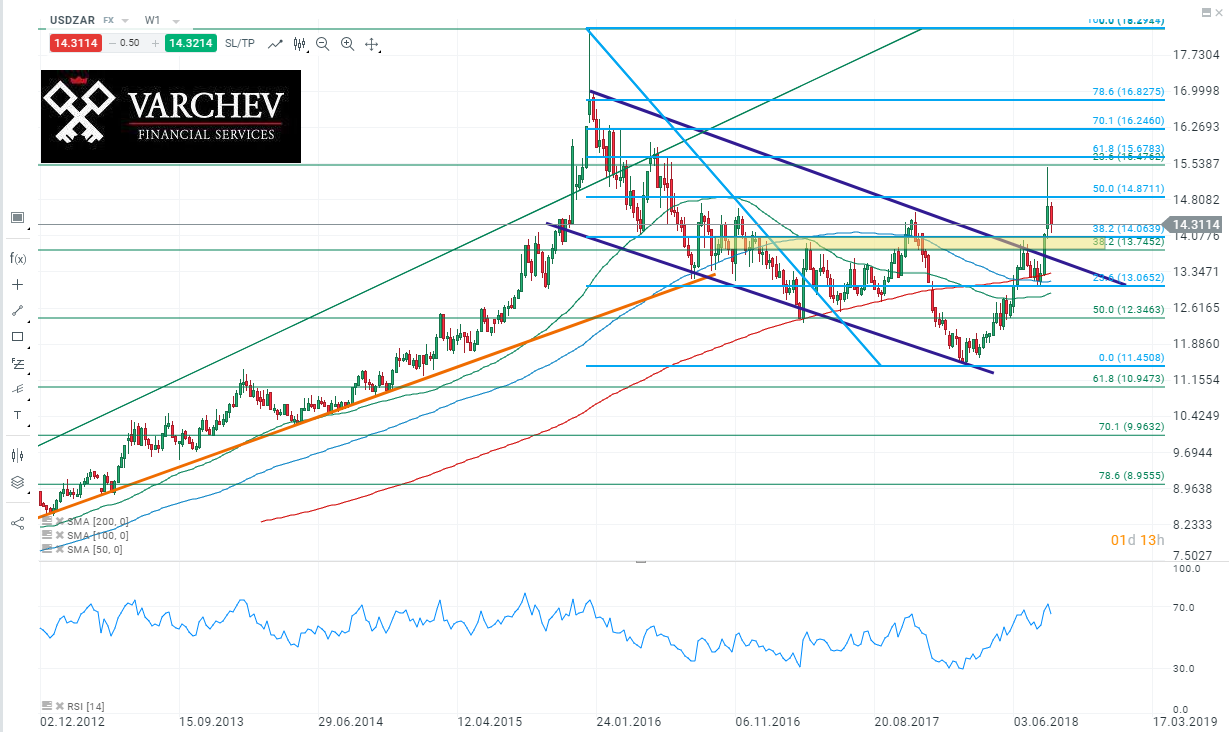
Technical picture: USD/ZAR

On the weekly chart we see an overall strong upwards trend, which was interrupted by a downwards trend that began on 10.01.2016. The bottom is reached on 11.02.2018 (right after the VIX implosion) at 11.5. On 05.08.2018 the price breaks out above the downwards trendline and passes above the 38,2% and 50% Fibonacci resistance levels. RSI and the bearish engulfing of this week point towards a correction to the downside. We expect USD/ZAR to decline to the major support around 14.00: Fibonacci cluster, previous high and the trendline break.
With the positive fundamentals in mind, as well as the trendline breakout, we will track the market for a potential long entry around 13,9-14,1.
SL: around 13.7081, a little bit below the breakout level from 10.08.2018.
Next resistance levels:
- 14.8-15
- 15.47-15.5, very important resistance level
If the price returns to the previous channel, we will consider the breakout false.
Source: Bloomberg Finance L.P.
Charts: MIT Economic Complexity Atlas, used under Creative Commons license
 Varchev Traders
 Read more:


If you think, we can improve that section,
please comment. Your oppinion is imortant for us.

