

- Home
- >
- Opportunities for profit today
- >
- USD/CAD: a possible new long at the bottom of the bull channel

USD/CAD: a possible new long at the bottom of the bull channel
Rating:

USD/CAD:
Date: July 15, 2016
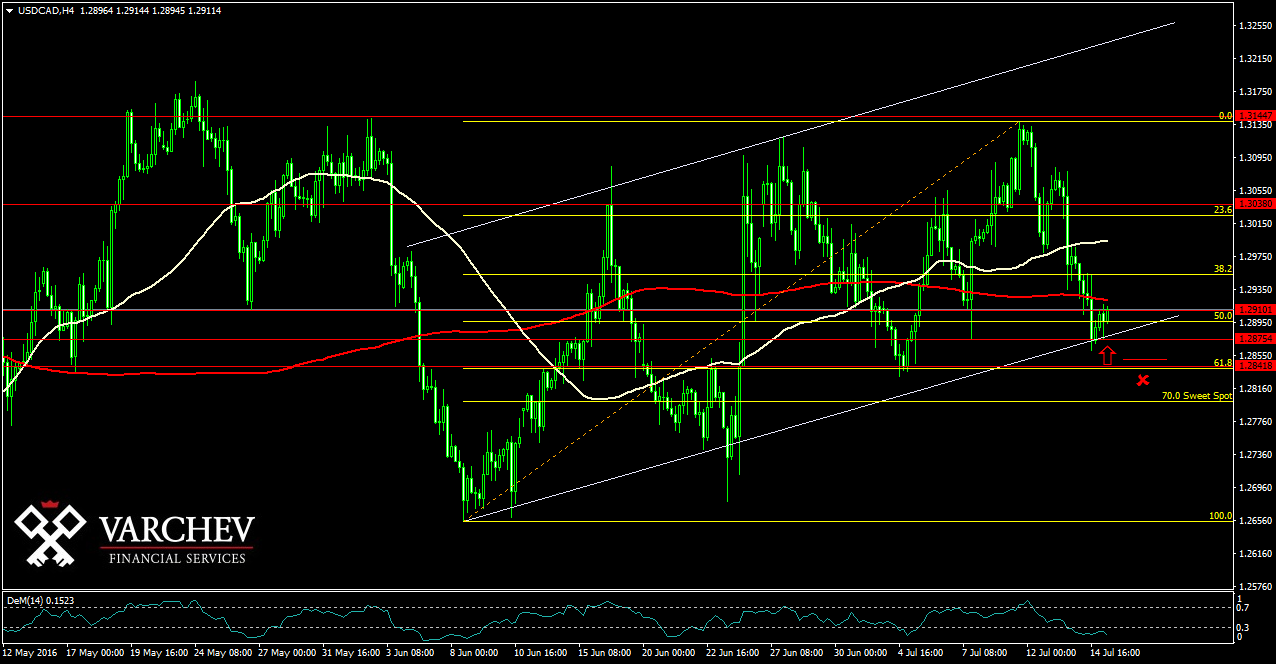
H4 chart: Choppy, Bull channel, long trend
The currency pair made a deep correction at the bottom of the channel. We also have a Fibo 50% from the previous movement and horizontal support. It was tested an the price is going up again.

Alternative scenario: If the price continues down, below the diagonal and horizontal supports, this may break the bull scenario and may show new possibilities for short positions after a breakthrough at the supports and retest .
Technical indicators
DEM (14) In overbought zone, it has not turned for long but the indicator is behind the price.
Price for long entry around: 1,2900
SL:1.28400
Jr. Trader - С. Fuchedzhiev
 Varchev Traders
 Read more:


RECCOMEND
WAS THIS POST USEFUL FOR YOU?
If you think, we can improve that section,
please comment. Your oppinion is imortant for us.
If you think, we can improve that section,
please comment. Your oppinion is imortant for us.

