

- Home
- >
- FX Daily Forecasts
- >
- USD/CAD: Change in sentiment – Change in Trend?

USD/CAD: Change in sentiment - Change in Trend?
Rating:

USD/CAD:
Date: May 19, 2018
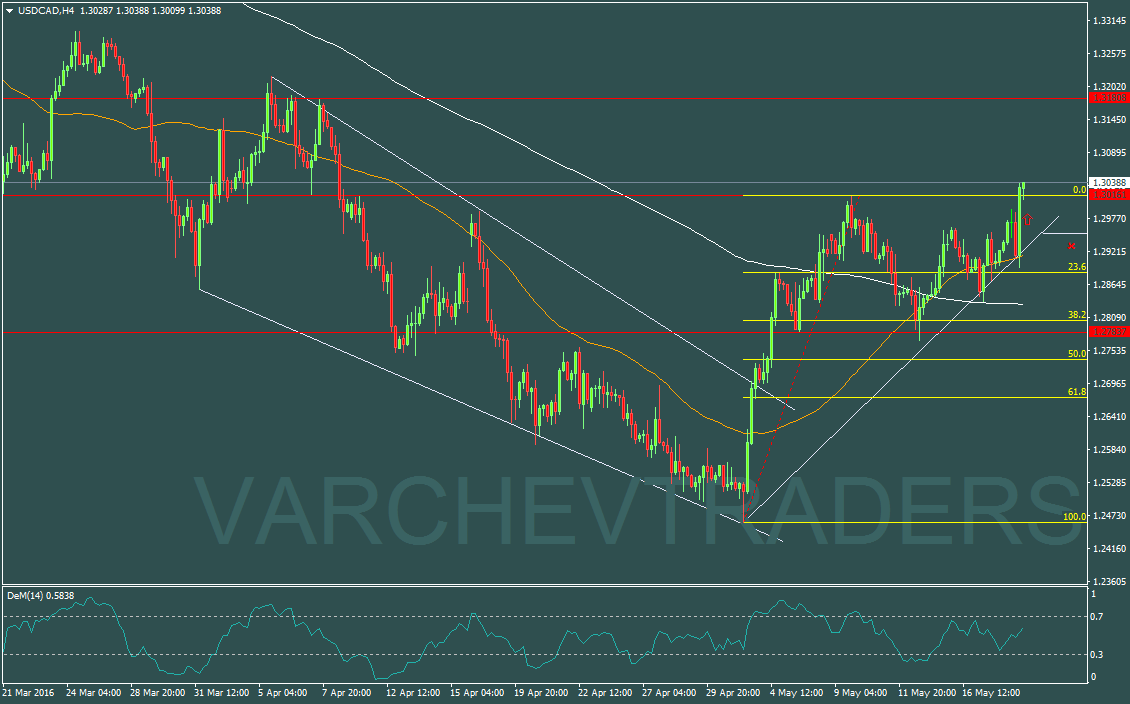
H4 Graph: Short Trend up to now, but may be this is change in trend
The price made a correction down to FIB 38,2% of the previous first long move and now it made three higher lows, respecting diagonal support line of the long move. The price has also broke key resistance level at 1,30150 and made a retest.
Price Action - Engulfing Bar - signal for long

Alternative Scenario: if the price move lower below 1.2950 and below the horizontal and diagonal support will cancel the bullish veiw.
DEM (14) H4 - is turned up for long
Price for Entry long around: - 1,30150
SL: 1.2950
Jr. Trader - S. Fuchedzhiev
 Varchev Traders
 Read more:


RECCOMEND
WAS THIS POST USEFUL FOR YOU?
If you think, we can improve that section,
please comment. Your oppinion is imortant for us.
If you think, we can improve that section,
please comment. Your oppinion is imortant for us.

