

- Home
- >
- FX Daily Forecasts
- >
- USD/CAD – good levels for sale after test and breakout

USD/CAD - good levels for sale after test and breakout
Rating:

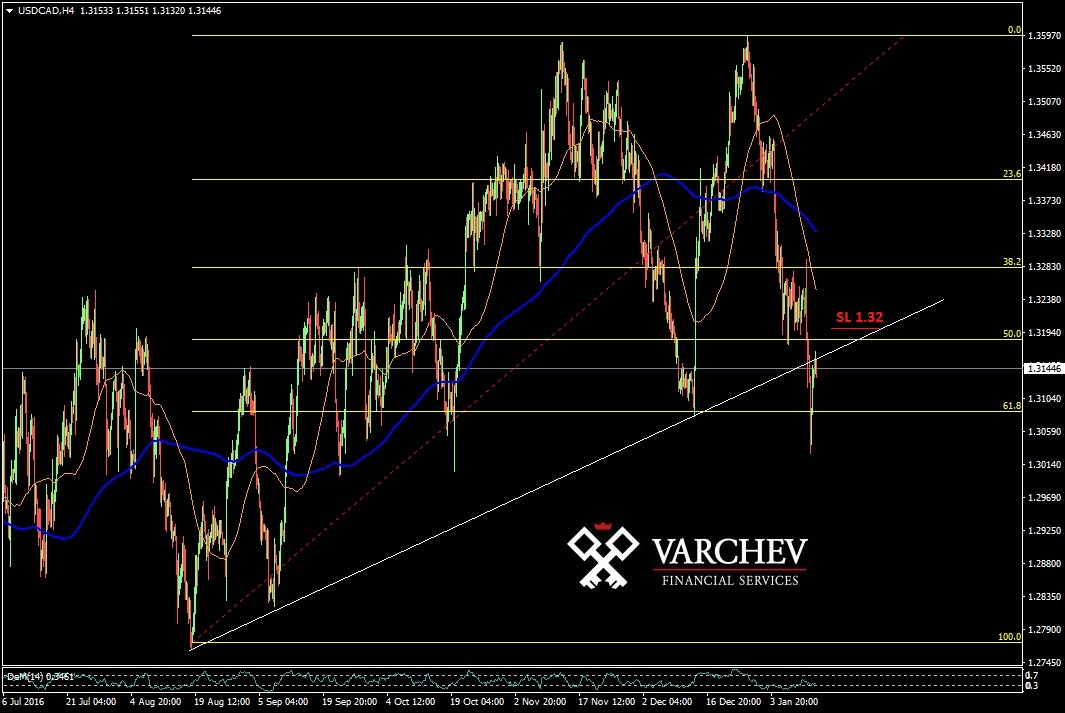
USD/CAD, H4, trend short.
Break of the former horizontal support, current resistance.
Break of Fibonacci 61.8%.
Breakout test, followed by rebound in a downtrend direction.
Price Action: Hanged man of resistance levels
Technical Indicators:
Indicators give mixed signals.
Price above 50SMA.
Price above 200SMA.
Death cross.
DeMarker, tursn up below 0.3 - positive signal!
SL: 1.32
Alternative scenario: Break of the former horizontal support, current resistance, would turn the price again into bullish trend channel.
Trader - G.Bozhidarov
 Varchev Traders
 Read more:


RECCOMEND
WAS THIS POST USEFUL FOR YOU?
If you think, we can improve that section,
please comment. Your oppinion is imortant for us.
If you think, we can improve that section,
please comment. Your oppinion is imortant for us.

