

- Home
- >
- FX Daily Forecasts
- >
- USD/CAD: Good place for long with the Trend

USD/CAD: Good place for long with the Trend
Rating:

USD/CAD:
Дата: 17 November, 2016
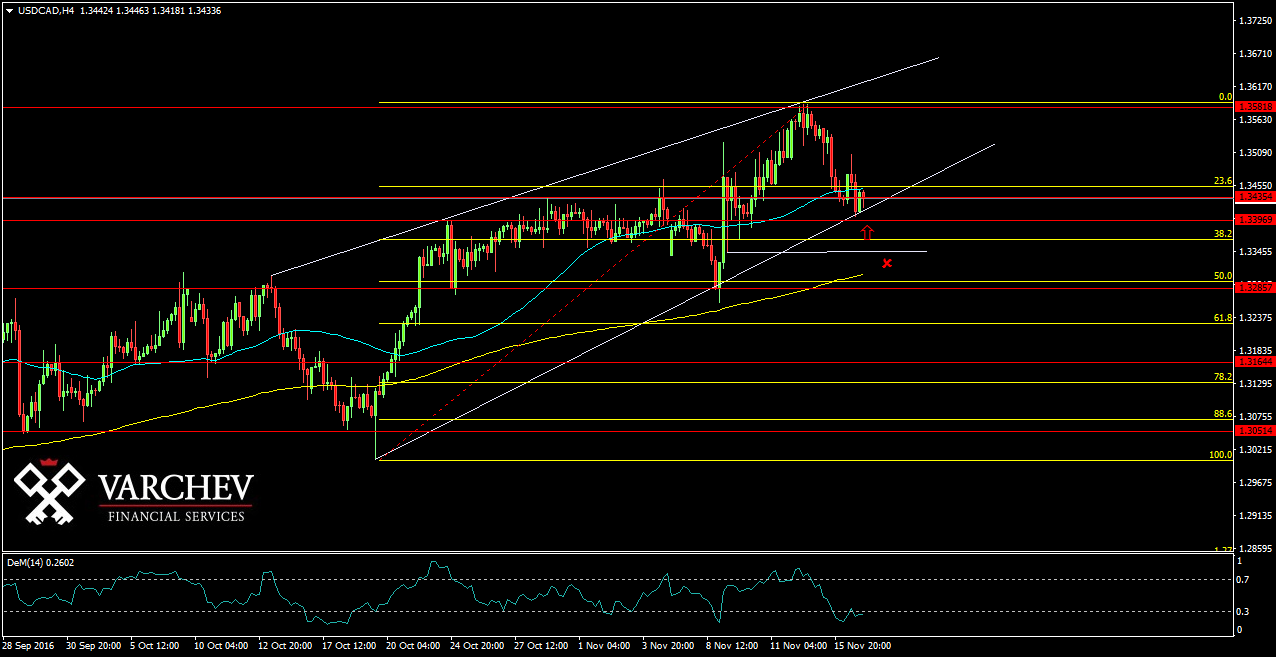
H4 Graph: Medium term long trend
Price made a correction down to zone with horizontal support and diagonal support. This zone also coinsides with Fib level of 23.6%. 50 EMA is above 200. The price is at the lower edge of the bullish up trend channel.

Alternative scenario: If the price breaks down and moves below the diagonal support and 1.337, will cancel the this bullish view.
Technical Indicator:
DEM (14) - In overbought zone and turned up for long
Price for Entry long around: 1,34100
SL: 1.33500
Jr. Trader - S. Fuchedzhiev
 Varchev Traders
 Read more:


RECCOMEND
WAS THIS POST USEFUL FOR YOU?
If you think, we can improve that section,
please comment. Your oppinion is imortant for us.
If you think, we can improve that section,
please comment. Your oppinion is imortant for us.

