

- Home
- >
- Daily Accents
- >
- USD/CAD: Long move is in play after end of the consolidation

USD/CAD: Long move is in play after end of the consolidation
Rating:

USD/CAD:
Date: 11 November, 2016
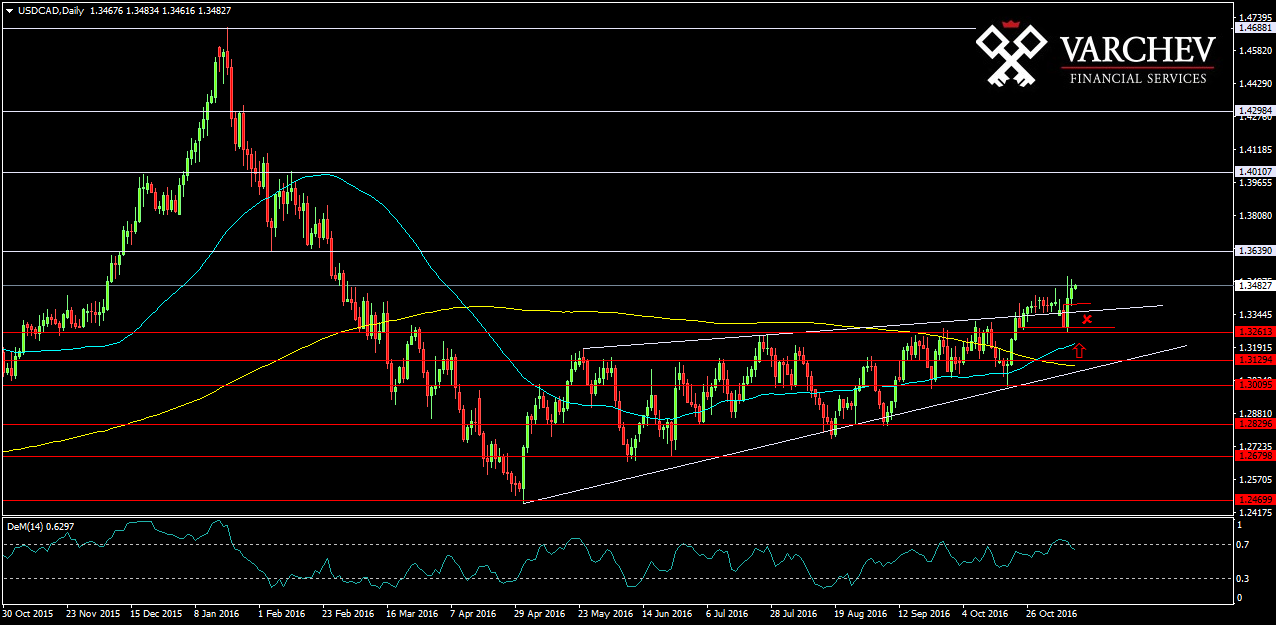
D1 Graph: Possible change in trend tendency long and end of the long consolidation.
The price broke up from its trading range and consolidation after the price moved up and trading above 1.32600. After the very short correction after the new high held and trading above the horizontal and diagonal support and now making a new high. 50 ЕМА is above 200 ЕМА.
Price Action: Engulfing bar at level of horizontal and diagonal support - possible signal for long.

Alternative scenario: If the price moves down and trades below the diagonal support and below the 1.339, this will cancel the bullish view.
Technical Indicator:
DEM (14) - Close to the overbought zone
Price for Entry around: 1,34500
SL: 1.3390
Jr. Trader - S. Fuchedzhiev
 Varchev Traders
 Read more:


If you think, we can improve that section,
please comment. Your oppinion is imortant for us.

