

- Home
- >
- FX Daily Forecasts
- >
- USD/CAD: New Long after a break of horizontal resistance

USD/CAD: New Long after a break of horizontal resistance
Rating:

USD/CAD:
Date: 20 January, 2017
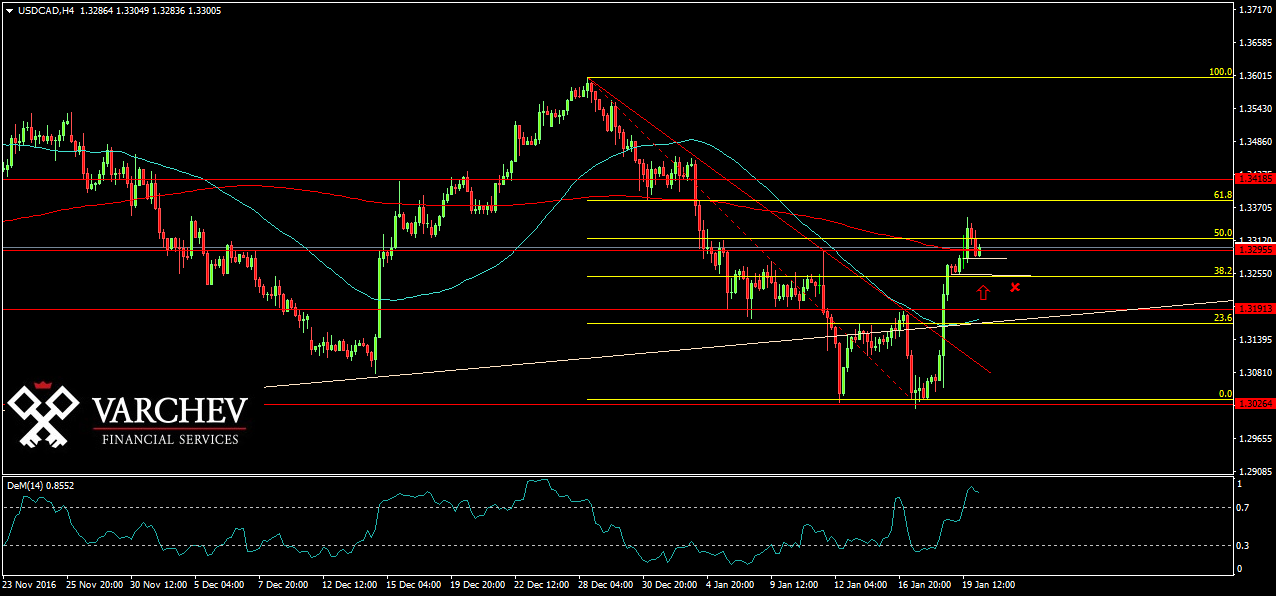
H4 Graph: Long term Trend, short term long trend
Price again started going up after finding a bottom around 1.3020/1.300. Price made a break of horizontal resistance at 1.33 and it came back to retest the break. Also the price is trading above the 50 and 200 ЕМА.
Price Action: Break up of a horizontal resistance - Possible signal for long.
DEM - In the overbought zone
Alternative scenario: If the price moves down again and passes below the horizontal support below 1.33 this will cancel the current setup.
Price for Entry long around: 1.32950
SL: 1.32400
Trader - S. Fuchedzhiev
 Varchev Traders
 Read more:


RECCOMEND
WAS THIS POST USEFUL FOR YOU?
If you think, we can improve that section,
please comment. Your oppinion is imortant for us.
If you think, we can improve that section,
please comment. Your oppinion is imortant for us.

