

- Home
- >
- FX Daily Forecasts
- >
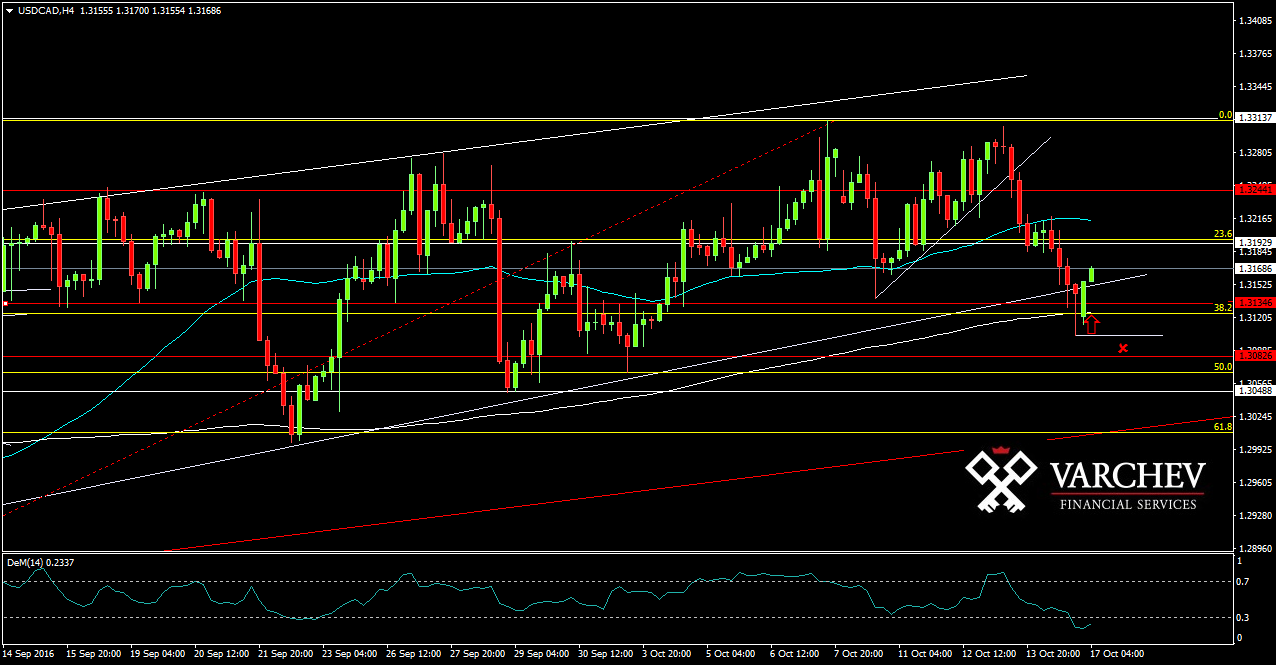
- USD/CAD: Possible new long, after correction to Fibo 38.2%

USD/CAD: Possible new long, after correction to Fibo 38.2%
Rating:

USD/CAD
Date: 17 October, 2016
H4 Graph: Long Trend
The price made a correction down to Fib 38,2% and horizontal support at 1,31350 and stated going up again. The diagonal support also supported the price
Price Action: Pin Bar on a level of strong support - Signal for long

Alternative scenario: If the price breaks down below the diagonal support and below the the Pin bar, this will cancel the the bullish view.
Technical Indicator:
DEM (14) - In the oversod zone and turned up for long
Price for Entry Long around: 1.31500
SL: 1.30900
Jr. Trader - S. Fuchedzhiev
 Varchev Traders
RECCOMEND
WAS THIS POST USEFUL FOR YOU?
If you think, we can improve that section,
please comment. Your oppinion is imortant for us.
If you think, we can improve that section,
please comment. Your oppinion is imortant for us.

