

- Home
- >
- FX Daily Forecasts
- >
- USD/CAD resistance levels, possible decrease

USD/CAD resistance levels, possible decrease
Rating:

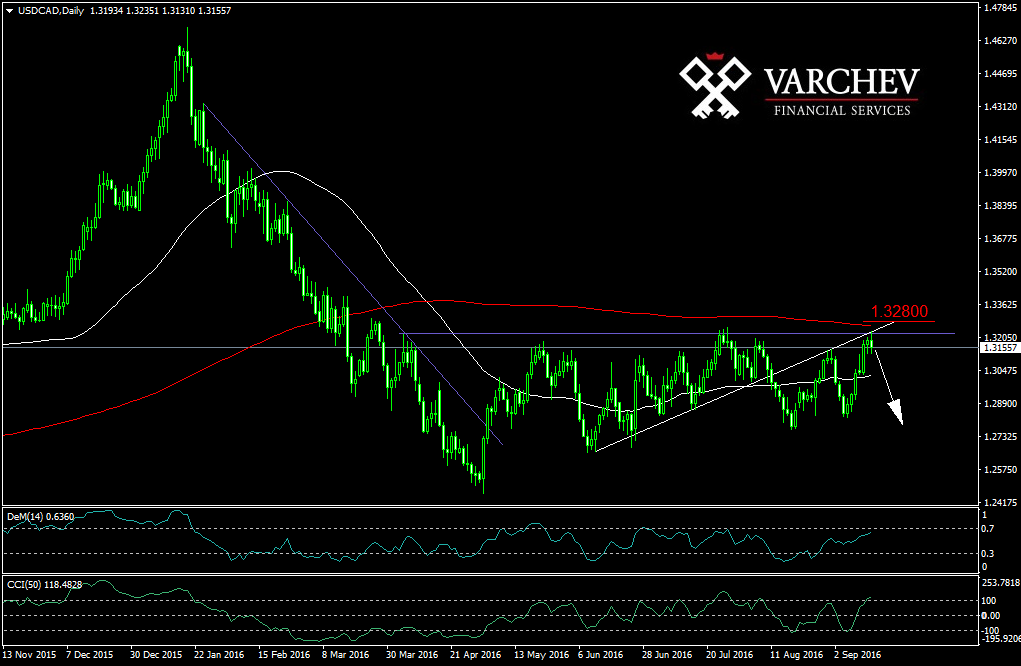
USD/CAD: Daily chart - downward movement and mid-term choppy
Price above diagonal and horizontal resistance - possible price recersal
Price action: Pin bar at diagonal and horizontal resistance - possible decrease
Technical indicator
50/200МА: 50 below 200, price below 200МА - negative signal
CCI(50): turning from overbought area - possible decline
SL 1.32800
Alternative scenario: If the price goes above 200MA it is possible the price to go out of the choppy and a new upward impulse to occur.
Jr_Trader_I_Ivanov
 Varchev Traders
 Read more:


RECCOMEND
WAS THIS POST USEFUL FOR YOU?
If you think, we can improve that section,
please comment. Your oppinion is imortant for us.
If you think, we can improve that section,
please comment. Your oppinion is imortant for us.

